жӮЁеҘҪпјҢзҷ»еҪ•еҗҺжүҚиғҪдёӢи®ўеҚ•е“ҰпјҒ
иҝҷзҜҮж–Үз« дё»иҰҒи®Іи§ЈдәҶpythonеҰӮдҪ•е®һзҺ°е№ізЁіж—¶й—ҙеәҸеҲ—зҡ„е»әжЁЎпјҢеҶ…е®№жё…жҷ°жҳҺдәҶпјҢеҜ№жӯӨжңүе…ҙи¶Јзҡ„е°ҸдјҷдјҙеҸҜд»ҘеӯҰд№ дёҖдёӢпјҢзӣёдҝЎеӨ§е®¶йҳ…иҜ»е®Ңд№ӢеҗҺдјҡжңүеё®еҠ©гҖӮ
дёҖгҖҒе№ізЁіеәҸеҲ—е»әжЁЎжӯҘйӘӨ
еҒҮеҰӮжҹҗдёӘи§ӮеҜҹеҖјеәҸеҲ—йҖҡиҝҮеәҸеҲ—йў„еӨ„зҗҶеҸҜд»ҘеҲӨе®ҡдёәе№ізЁійқһзҷҪеҷӘеЈ°еәҸеҲ—пјҢе°ұеҸҜд»ҘеҲ©з”ЁARMAжЁЎеһӢеҜ№иҜҘеәҸеҲ—иҝӣиЎҢе»әжЁЎгҖӮе»әжЁЎзҡ„еҹәжң¬жӯҘйӘӨеҰӮдёӢпјҡ
пјҲ1пјүжұӮеҮәиҜҘи§ӮеҜҹеҖјеәҸеҲ—зҡ„ж ·жң¬иҮӘзӣёе…ізі»ж•°пјҲACFпјүе’Ңж ·жң¬еҒҸиҮӘзӣёе…ізі»ж•°пјҲPACFпјүзҡ„еҖјгҖӮ
пјҲ2пјүж №жҚ®ж ·жң¬иҮӘзӣёе…ізі»ж•°е’ҢеҒҸиҮӘзӣёе…ізі»ж•°зҡ„жҖ§иҙЁпјҢйҖүжӢ©йҖӮеҪ“зҡ„ARMAпјҲpпјҢqпјүжЁЎеһӢиҝӣиЎҢжӢҹеҗҲгҖӮ
пјҲ3пјүдј°и®ЎжЁЎеһӢдёӯдҪҚзҪ®еҸӮж•°зҡ„еҖјгҖӮ
пјҲ4пјүжЈҖйӘҢжЁЎеһӢзҡ„жңүж•ҲжҖ§гҖӮеҰӮжһңжЁЎеһӢдёҚйҖҡиҝҮжЈҖйӘҢпјҢиҪ¬еҗ‘жӯҘйӘӨпјҲ2пјүпјҢйҮҚж–°йҖүжӢ©жЁЎеһӢеҶҚжӢҹеҗҲгҖӮ
пјҲ5пјүжЁЎеһӢдјҳеҢ–гҖӮеҰӮжһңжӢҹеҗҲжЁЎеһӢйҖҡиҝҮжЈҖйӘҢпјҢд»Қ然иҪ¬еҗ‘дёҚиө°пјҲ2пјүпјҢе……еҲҶиҖғиҷ‘еҗ„з§Қжғ…еҶөпјҢе»әз«ӢеӨҡдёӘжӢҹеҗҲжЁЎеһӢпјҢд»ҺжүҖжңүйҖҡиҝҮжЈҖйӘҢзҡ„жӢҹеҗҲжЁЎеһӢдёӯйҖүжӢ©жңҖдјҳжЁЎеһӢгҖӮ
пјҲ6пјүеҲ©з”ЁжӢҹеҗҲжЁЎеһӢпјҢйў„жөӢеәҸеҲ—зҡ„е°ҶжқҘиө°еҠҝгҖӮ
дәҢгҖҒд»Јз Ғе®һзҺ°
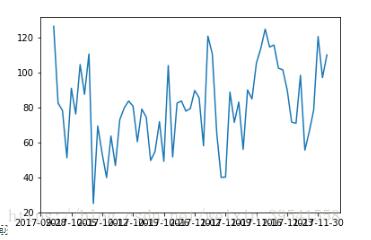
1гҖҒз»ҳеҲ¶ж—¶еәҸеӣҫпјҢжҹҘзңӢж•°жҚ®зҡ„еӨ§жҰӮеҲҶеёғ
trainSeting.head()
Out[36]:
date
2017-10-01 126.4
2017-10-02  82.4
2017-10-03  78.1
2017-10-04  51.1
2017-10-05  90.9
Name: sales, dtype: float64

plt.plot(trainSeting)
2гҖҒе№ізЁіжҖ§жЈҖйӘҢ
'''иҝӣиЎҢADFжЈҖйӘҢ
adf_testзҡ„иҝ”еӣһеҖј
Test statisticпјҡд»ЈиЎЁжЈҖйӘҢз»ҹи®ЎйҮҸ
p-valueпјҡд»ЈиЎЁpеҖјжЈҖйӘҢзҡ„жҰӮзҺҮ
Lags usedпјҡдҪҝз”Ёзҡ„ж»һеҗҺkпјҢautolag=AICж—¶дјҡиҮӘеҠЁйҖүжӢ©ж»һеҗҺ
Number of Observations Usedпјҡж ·жң¬ж•°йҮҸ
Critical Value(5%) : жҳҫи‘—жҖ§ж°ҙе№ідёә5%зҡ„дёҙз•ҢеҖјгҖӮ
(1)еҒҮи®ҫжҳҜеӯҳеңЁеҚ•дҪҚж №пјҢеҚідёҚе№ізЁіпјӣ
(2)жҳҫи‘—жҖ§ж°ҙе№іпјҢ1%пјҡдёҘж јжӢ’з»қеҺҹеҒҮи®ҫпјӣ5%пјҡжӢ’з»қеҺҹеҒҮи®ҫпјҢ10%зұ»жҺЁгҖӮ
(3)зңӢPеҖје’Ңжҳҫи‘—жҖ§ж°ҙе№іaзҡ„еӨ§е°ҸпјҢpеҖји¶Ҡе°ҸпјҢе°ҸдәҺжҳҫи‘—жҖ§ж°ҙе№ізҡ„иҜқпјҢе°ұжӢ’з»қеҺҹеҒҮи®ҫпјҢи®ӨдёәеәҸеҲ—жҳҜе№ізЁізҡ„пјӣеӨ§дәҺзҡ„иҜқпјҢдёҚиғҪжӢ’з»қпјҢи®ӨдёәжҳҜдёҚе№ізЁізҡ„
(4)зңӢжЈҖйӘҢз»ҹи®ЎйҮҸе’Ңдёҙз•ҢеҖјпјҢжЈҖйӘҢз»ҹи®ЎйҮҸе°ҸдәҺдёҙз•ҢеҖјзҡ„иҜқпјҢе°ұжӢ’з»қеҺҹеҒҮи®ҫпјҢи®ӨдёәеәҸеҲ—жҳҜе№ізЁізҡ„пјӣеӨ§дәҺзҡ„иҜқпјҢдёҚиғҪжӢ’з»қпјҢи®ӨдёәжҳҜдёҚе№ізЁізҡ„
'''
#ж»ҡеҠЁз»ҹи®Ў
def rolling_statistics(timeseries):
#Determing rolling statistics
rolmean = pd.rolling_mean(timeseries, window=12)
rolstd = pd.rolling_std(timeseries, window=12)
#Plot rolling statistics:
orig = plt.plot(timeseries, color='blue',label='Original')
mean = plt.plot(rolmean, color='red', label='Rolling Mean')
std = plt.plot(rolstd, color='black', label = 'Rolling Std')
plt.legend(loc='best')
plt.title('Rolling Mean & Standard Deviation')
plt.show(block=False)
##ADFжЈҖйӘҢ
from statsmodels.tsa.stattools import adfuller
def adf_test(timeseries):
rolling_statistics(timeseries)#з»ҳеӣҫ
print ('Results of Augment Dickey-Fuller Test:')
dftest = adfuller(timeseries, autolag='AIC')
dfoutput = pd.Series(dftest[0:4], index=['Test Statistic','p-value','#Lags Used','Number of Observations Used'])
for key,value in dftest[4].items():
dfoutput['Critical Value (%s)'%key] = value #еўһеҠ еҗҺйқўзҡ„жҳҫи‘—жҖ§ж°ҙе№ізҡ„дёҙз•ҢеҖј
print (dfoutput)
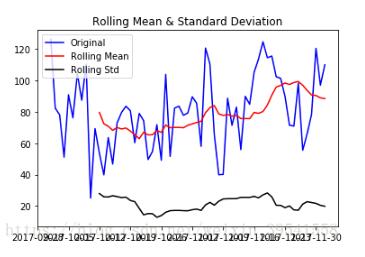
adf_test(trainSeting) #д»Һз»“жһңдёӯеҸҜд»ҘзңӢеҲ°pеҖјдёә0.1097>0.1пјҢдёҚиғҪжӢ’з»қH0,и®ӨдёәиҜҘеәҸеҲ—дёҚжҳҜе№ізЁіеәҸеҲ—иҝ”еӣһз»“жһңеҰӮдёӢ
Results of Augment Dickey-Fuller Test:
Test Statistic    -5.718539e+00
p-value      7.028398e-07
#Lags Used      0.000000e+00
Number of Observations Used 6.200000e+01
Critical Value (1%)   -3.540523e+00
Critical Value (5%)   -2.909427e+00
Critical Value (10%)   -2.592314e+00
dtype: float64
йҖҡиҝҮдёҠйқўеҸҜд»ҘзңӢеҲ°пјҢpеҖје°ҸдәҺ0.05пјҢеҸҜд»Ҙи®ӨдёәиҜҘеәҸеҲ—дёәе№ізЁіж—¶й—ҙеәҸеҲ—гҖӮ
3гҖҒзҷҪеҷӘеЈ°жЈҖйӘҢ
'''acorr_ljungbox(x, lags=None, boxpierce=False)еҮҪж•°жЈҖйӘҢж— иҮӘзӣёе…і lagsдёә延иҝҹжңҹж•°пјҢеҰӮжһңдёәж•ҙж•°пјҢеҲҷжҳҜеҢ…еҗ«еңЁеҶ…зҡ„延иҝҹжңҹж•°пјҢеҰӮжһңжҳҜдёҖдёӘеҲ—иЎЁжҲ–ж•°з»„пјҢйӮЈд№ҲжүҖжңүж—¶ж»һйғҪеҢ…еҗ«еңЁеҲ—иЎЁдёӯжңҖеӨ§зҡ„ж—¶ж»һдёӯ boxpierceдёәTrueж—¶иЎЁзӨәйҷӨејҖиҝ”еӣһLBз»ҹи®ЎйҮҸиҝҳдјҡиҝ”еӣһBoxе’ҢPierceзҡ„Qз»ҹи®ЎйҮҸ иҝ”еӣһеҖјпјҡ lbvalue:жөӢиҜ•зҡ„з»ҹи®ЎйҮҸ pvalue:еҹәдәҺеҚЎж–№еҲҶеёғзҡ„pз»ҹи®ЎйҮҸ bpvalue:((optionsal), float or array) вҖ“ test statistic for Box-Pierce test bppvalue:((optional), float or array) вҖ“ p-value based for Box-Pierce test on chi-square distribution ''' from statsmodels.stats.diagnostic import acorr_ljungbox def test_stochastic(ts,lag): p_value = acorr_ljungbox(ts, lags=lag) #lagsеҸҜиҮӘе®ҡд№ү return p_value
test_stochastic(trainSeting,[6,12])
Out[62]: (array([13.28395274, 14.89281684]), array([0.03874194, 0.24735042]))
д»ҺдёҠйқўзҡ„еҲҶжһҗз»“жһңдёӯеҸҜд»ҘзңӢеҲ°пјҢ延иҝҹ6йҳ¶зҡ„pеҖјдёә0.03<0.05пјҢеӣ жӯӨеҸҜд»ҘжӢ’з»қеҺҹеҒҮи®ҫпјҢи®ӨдёәиҜҘеәҸеҲ—дёҚжҳҜзҷҪеҷӘеЈ°еәҸеҲ—гҖӮ
4гҖҒзЎ®е®ҡARMAзҡ„йҳ¶ж•°
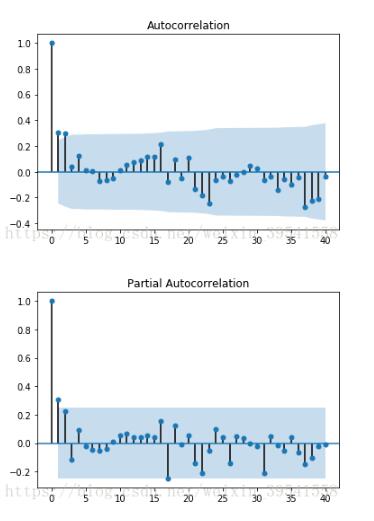
пјҲ1пјүеҲ©з”ЁиҮӘзӣёе…іеӣҫе’ҢеҒҸиҮӘзӣёе…іеӣҫ
####иҮӘзӣёе…іеӣҫACFе’ҢеҒҸзӣёе…іеӣҫPACF import statsmodels.api as sm def acf_pacf_plot(ts_log_diff): sm.graphics.tsa.plot_acf(ts_log_diff,lags=40) #ARIMA,q sm.graphics.tsa.plot_pacf(ts_log_diff,lags=40) #ARIMA,p acf_pacf_plot(trainSeting) #жҹҘзңӢж•°жҚ®зҡ„иҮӘзӣёе…іеӣҫе’ҢеҒҸиҮӘзӣёе…іеӣҫ
пјҲ2пјүеҖҹеҠ©AICгҖҒBICз»ҹи®ЎйҮҸиҮӘеҠЁзЎ®е®ҡ
##еҖҹеҠ©AICгҖҒBICз»ҹи®ЎйҮҸиҮӘеҠЁзЎ®е®ҡ
from statsmodels.tsa.arima_model import ARMA
def proper_model(data_ts, maxLag):
init_bic = float("inf")
init_p = 0
init_q = 0
init_properModel = None
for p in np.arange(maxLag):
for q in np.arange(maxLag):
model = ARMA(data_ts, order=(p, q))
try:
results_ARMA = model.fit(disp=-1, method='css')
except:
continue
bic = results_ARMA.bic
if bic < init_bic:
init_p = p
init_q = q
init_properModel = results_ARMA
init_bic = bic
return init_bic, init_p, init_q, init_properModel
proper_model(trainSeting,40)#еңЁstatsmodelsеҢ…йҮҢиҝҳжңүжӣҙзӣҙжҺҘзҡ„еҮҪж•°пјҡ import statsmodels.tsa.stattools as st order = st.arma_order_select_ic(ts_log_diff2,max_ar=5,max_ma=5,ic=['aic', 'bic', 'hqic']) order.bic_min_order ''' жҲ‘们常用зҡ„жҳҜAICеҮҶеҲҷпјҢAICйј“еҠұж•°жҚ®жӢҹеҗҲзҡ„дјҳиүҜжҖ§дҪҶжҳҜе°ҪйҮҸйҒҝе…ҚеҮәзҺ°иҝҮеәҰжӢҹеҗҲ(Overfitting)зҡ„жғ…еҶөгҖӮжүҖд»Ҙдјҳе…ҲиҖғиҷ‘зҡ„жЁЎеһӢеә”жҳҜAICеҖјжңҖе°Ҹзҡ„йӮЈдёҖдёӘжЁЎеһӢгҖӮ дёәдәҶжҺ§еҲ¶и®Ўз®—йҮҸпјҢжҲ‘们йҷҗеҲ¶ARжңҖеӨ§йҳ¶дёҚи¶…иҝҮ5пјҢMAжңҖеӨ§йҳ¶дёҚи¶…иҝҮ5гҖӮ дҪҶжҳҜиҝҷж ·еёҰжқҘзҡ„еқҸеӨ„жҳҜеҸҜиғҪдёәеұҖйғЁжңҖдјҳгҖӮ timeseriesжҳҜеҫ…иҫ“е…Ҙзҡ„ж—¶й—ҙеәҸеҲ—пјҢжҳҜpandas.Seriesзұ»еһӢпјҢmax_arгҖҒmax_maжҳҜpгҖҒqеҖјзҡ„жңҖеӨ§еӨҮйҖүеҖјгҖӮ order.bic_min_orderиҝ”еӣһд»ҘBICеҮҶеҲҷзЎ®е®ҡзҡ„йҳ¶ж•°пјҢжҳҜдёҖдёӘtupleзұ»еһӢ
иҝ”еӣһеҖјеҰӮдёӢпјҡ
order.bic_min_order
Out[13]: (1, 0)
5гҖҒе»әжЁЎ
д»ҺдёҠиҝ°з»“жһңдёӯеҸҜд»ҘзңӢеҲ°пјҢеҸҜд»ҘйҖүжӢ©AR(1)жЁЎеһӢ
################################жЁЎеһӢ######################################
# ARжЁЎеһӢпјҢq=0
#RSSжҳҜж®Ӣе·®е№іж–№е’Ң
# dispдёә-1д»ЈиЎЁдёҚиҫ“еҮә收ж•ӣиҝҮзЁӢзҡ„дҝЎжҒҜпјҢTrueд»ЈиЎЁиҫ“еҮә
from statsmodels.tsa.arima_model import ARIMA
model = ARIMA(trainSeting,order=(1,0,0)) #第дәҢдёӘеҸӮж•°д»ЈиЎЁдҪҝз”ЁдәҶдәҢйҳ¶е·®еҲҶ
results_AR = model.fit(disp=-1)
plt.plot(trainSeting)
plt.plot(results_AR.fittedvalues, color='red') #зәўиүІзәҝд»ЈиЎЁйў„жөӢеҖј
plt.title('RSS:%.4f' % sum((results_AR.fittedvalues-trainSeting)**2))#ж®Ӣе·®е№іж–№е’Ң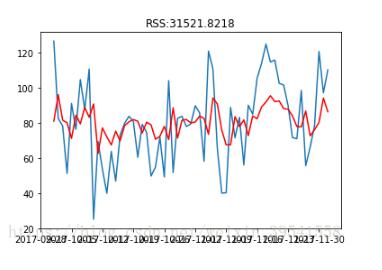
6гҖҒйў„жөӢжңӘжқҘиө°еҠҝ
############################йў„жөӢжңӘжқҘиө°еҠҝ########################################## # forecastж–№жі•дјҡиҮӘеҠЁиҝӣиЎҢе·®еҲҶиҝҳеҺҹпјҢеҪ“然仅йҷҗдәҺж”ҜжҢҒзҡ„1йҳ¶е’Ң2йҳ¶е·®еҲҶ forecast_n = 12 #йў„жөӢжңӘжқҘ12дёӘеӨ©иө°еҠҝ forecast_AR = results_AR.forecast(forecast_n) forecast_AR = forecast_AR[0] print (forecast_AR)
print (forecast_ARIMA_log)
[90.49452199 84.05407353 81.92752342 81.22536496 80.99352161 80.9169700380.89169372 80.88334782 80.88059211 80.87968222 80.87938178 80.87928258]
##е°Ҷйў„жөӢзҡ„ж•°жҚ®е’ҢеҺҹжқҘзҡ„ж•°жҚ®з»ҳеҲ¶еңЁдёҖиө·пјҢдёәдәҶе®һзҺ°иҝҷдёҖзӣ®зҡ„пјҢжҲ‘们йңҖиҰҒеўһеҠ ж•°жҚ®зҙўеј•пјҢдҪҝз”ЁејҖжәҗеә“arrow:
import arrow
def get_date_range(start, limit, level='day',format='YYYY-MM-DD'):
start = arrow.get(start, format)
result=(list(map(lambda dt: dt.format(format) , arrow.Arrow.range(level, start,limit=limit))))
dateparse2 = lambda dates:pd.datetime.strptime(dates,'%Y-%m-%d')
return map(dateparse2, result)
# йў„жөӢд»Һ2017-12-03ејҖе§ӢпјҢд№ҹе°ұжҳҜжҲ‘们и®ӯз»ғж•°жҚ®жңҖеҗҺдёҖдёӘж•°жҚ®зҡ„еҗҺдёҖдёӘж—Ҙжңҹ
new_index = get_date_range('2017-12-03', forecast_n)
forecast_ARIMA_log = pd.Series(forecast_AR, copy=True, index=new_index)
print (forecast_ARIMA_log.head())
##з»ҳеӣҫеҰӮдёӢ
plt.plot(trainSeting,label='Original',color='blue')
plt.plot(forecast_ARIMA_log, label='Forcast',color='red')
plt.legend(loc='best')
plt.title('forecast')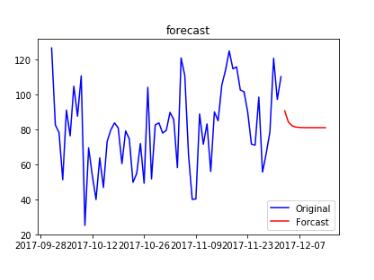
зңӢе®ҢдёҠиҝ°еҶ…е®№пјҢжҳҜдёҚжҳҜеҜ№pythonеҰӮдҪ•е®һзҺ°е№ізЁіж—¶й—ҙеәҸеҲ—зҡ„е»әжЁЎжңүиҝӣдёҖжӯҘзҡ„дәҶи§ЈпјҢеҰӮжһңиҝҳжғіеӯҰд№ жӣҙеӨҡеҶ…е®№пјҢж¬ўиҝҺе…іжіЁдәҝйҖҹдә‘иЎҢдёҡиө„и®Ҝйў‘йҒ“гҖӮ
е…ҚиҙЈеЈ°жҳҺпјҡжң¬з«ҷеҸ‘еёғзҡ„еҶ…е®№пјҲеӣҫзүҮгҖҒи§Ҷйў‘е’Ңж–Үеӯ—пјүд»ҘеҺҹеҲӣгҖҒиҪ¬иҪҪе’ҢеҲҶдә«дёәдё»пјҢж–Үз« и§ӮзӮ№дёҚд»ЈиЎЁжң¬зҪ‘з«ҷз«ӢеңәпјҢеҰӮжһңж¶үеҸҠдҫөжқғиҜ·иҒ”зі»з«ҷй•ҝйӮ®з®ұпјҡis@yisu.comиҝӣиЎҢдёҫжҠҘпјҢ并жҸҗдҫӣзӣёе…іиҜҒжҚ®пјҢдёҖз»ҸжҹҘе®һпјҢе°Ҷз«ӢеҲ»еҲ йҷӨж¶үе«ҢдҫөжқғеҶ…е®№гҖӮ
жӮЁеҘҪпјҢзҷ»еҪ•еҗҺжүҚиғҪдёӢи®ўеҚ•е“ҰпјҒ