您好,登录后才能下订单哦!
这期内容当中小编将会给大家带来有关怎么在Django中使用Bokeh实现数据可视化,文章内容丰富且以专业的角度为大家分析和叙述,阅读完这篇文章希望大家可以有所收获。
1. 波形图
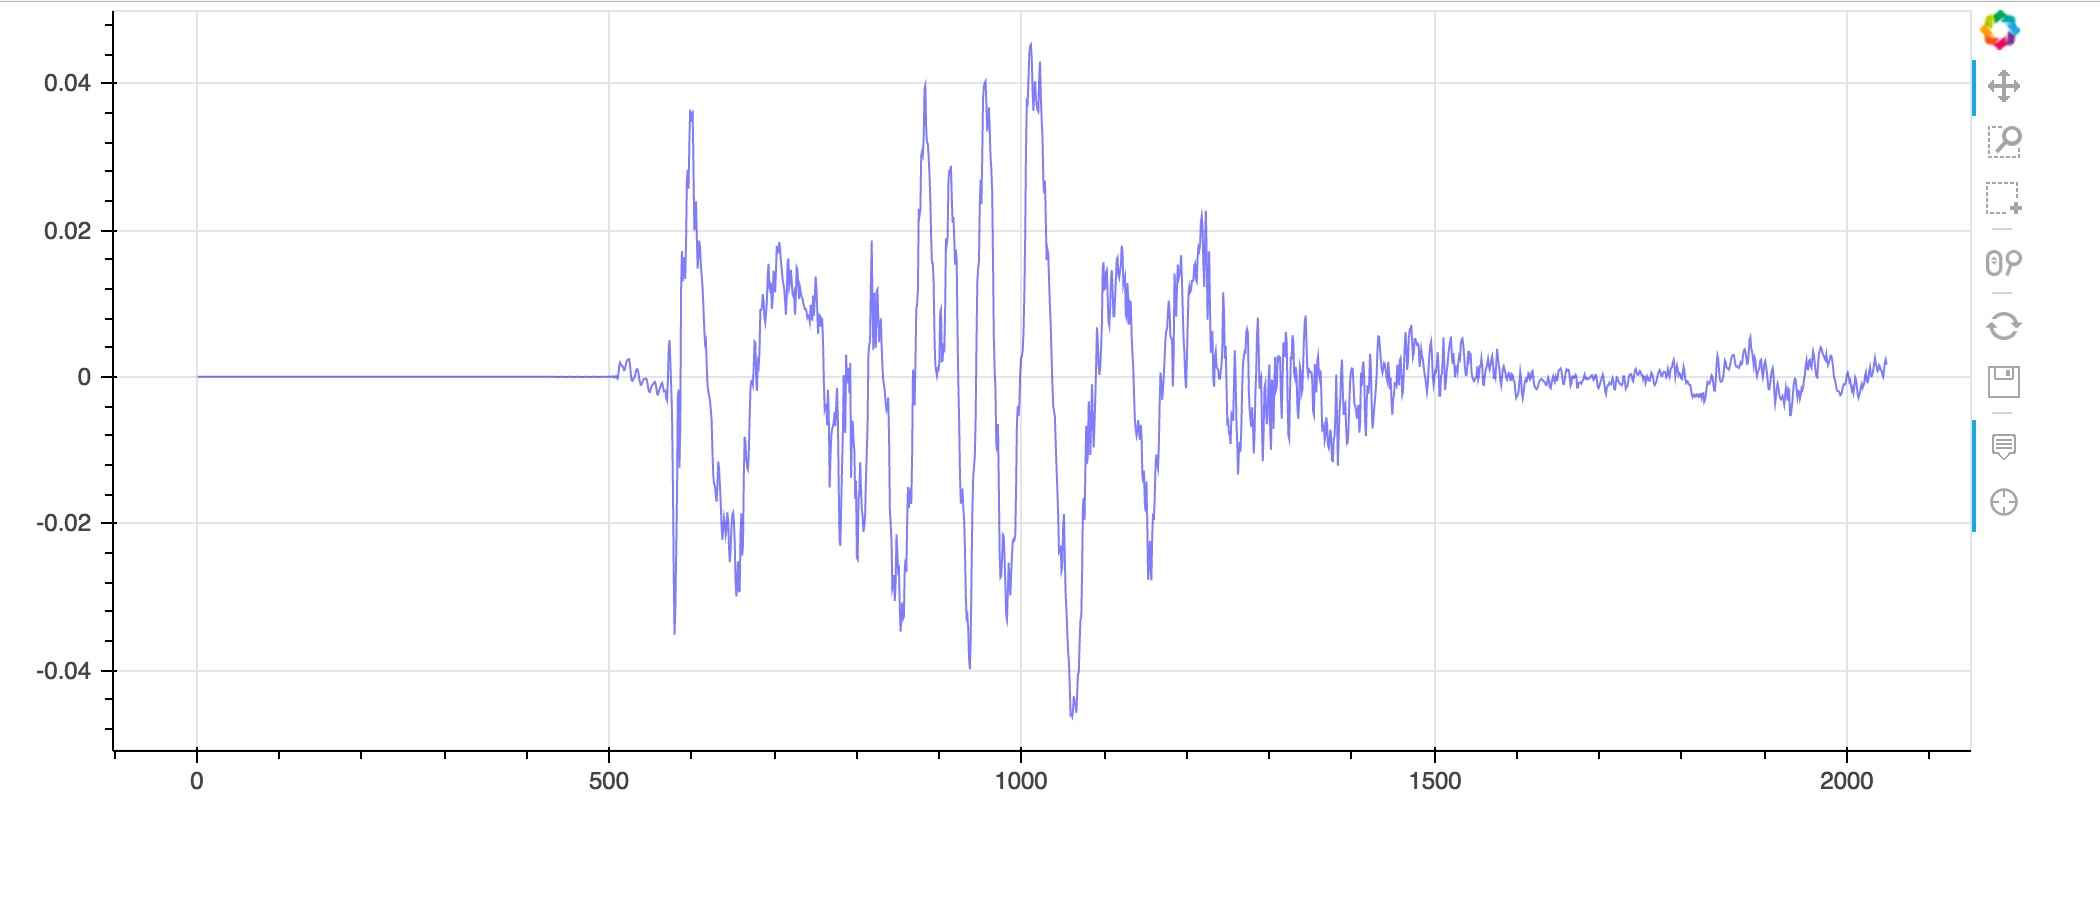
这里绘制一个包含了数千个数据点的信号波形图,绘制方法和 Matlab 如出一辙。学习成本为零。
import pandas as pd
from bokeh.plotting import figure
from bokeh.io import output_file, show

csv_file = 'points.csv'
data = pd.read_csv(csv_file)
TOOLS = 'hover,crosshair,pan,wheel_zoom,box_zoom,reset,save,box_select'
picture = figure(width=1000, height=400, tools=TOOLS)
picture.line(data['order'], data['value'], color='blue', alpha=0.5)
output_file('waveform.html', title='waveform')
show(picture)
points.csv 中包含了 2048 个点。上面这段脚本是直接生成了一个 html 文件,show(picture)语句打开了这个 html 文件。效果如下:

右侧的工具栏是通过TOOLS = 'hover,crosshair,pan,wheel_zoom,box_zoom,reset,save,box_select'设置的。包含了常见的一些功能,包括缩放,保存,重置等等。由于简书的 markdown 不支持直接插入 div 块和 js 脚本,所以只能截取一个图放在这里,不能体验到右侧的工具栏的使用感受。
2. 集成到 Django 中
上面的例子是直接生成了一个 html 文件,但在正常的使用中,只应该生成对应的 div 和 js 就行了。
在 Django 的 view.py 中,定义一个 view。
def waveform(request):
  csv_file = 'your file'
  data = pd.read_csv(csv_file)
  TOOLS = "hover,crosshair,pan,wheel_zoom,box_zoom,reset,save,box_select"
  picture = figure(width=1200, height=400, tools=TOOLS)
  picture.line(data['order'], data['value'], color='blue', alpha=0.5)
  script, div = components(picture, CDN)
  return render(request, 'waveform.html', {'script': script, 'div': div})
这样就把对应的 template 的 waveform.html 中:
{% load static %}
<!DOCTYPE html>
<html lang="en">
<head>
  <meta charset="UTF-8">
  <title>Experiment with Bokeh</title>
  <link href="{% static 'bokeh-0.12.4.min.css' %}" rel="stylesheet" type="text/css">
  <link href="{% static 'bokeh-widgets-0.12.4.min.css' %}" rel="stylesheet" type="text/css">
  <script src="{% static 'bokeh-0.12.4.min.js' %}"></script>
  <script src="{% static 'bokeh-widgets-0.12.4.min.js' %}"></script>
  {{ script |safe }}
</head>
<body>
{{ div |safe }}
</body>
</html>
这里有一个不太好的地方,把 script 放到了 head 里面。
然而要是放在底部。就不能正确画出图了。(求大神解答)
3. 时频图
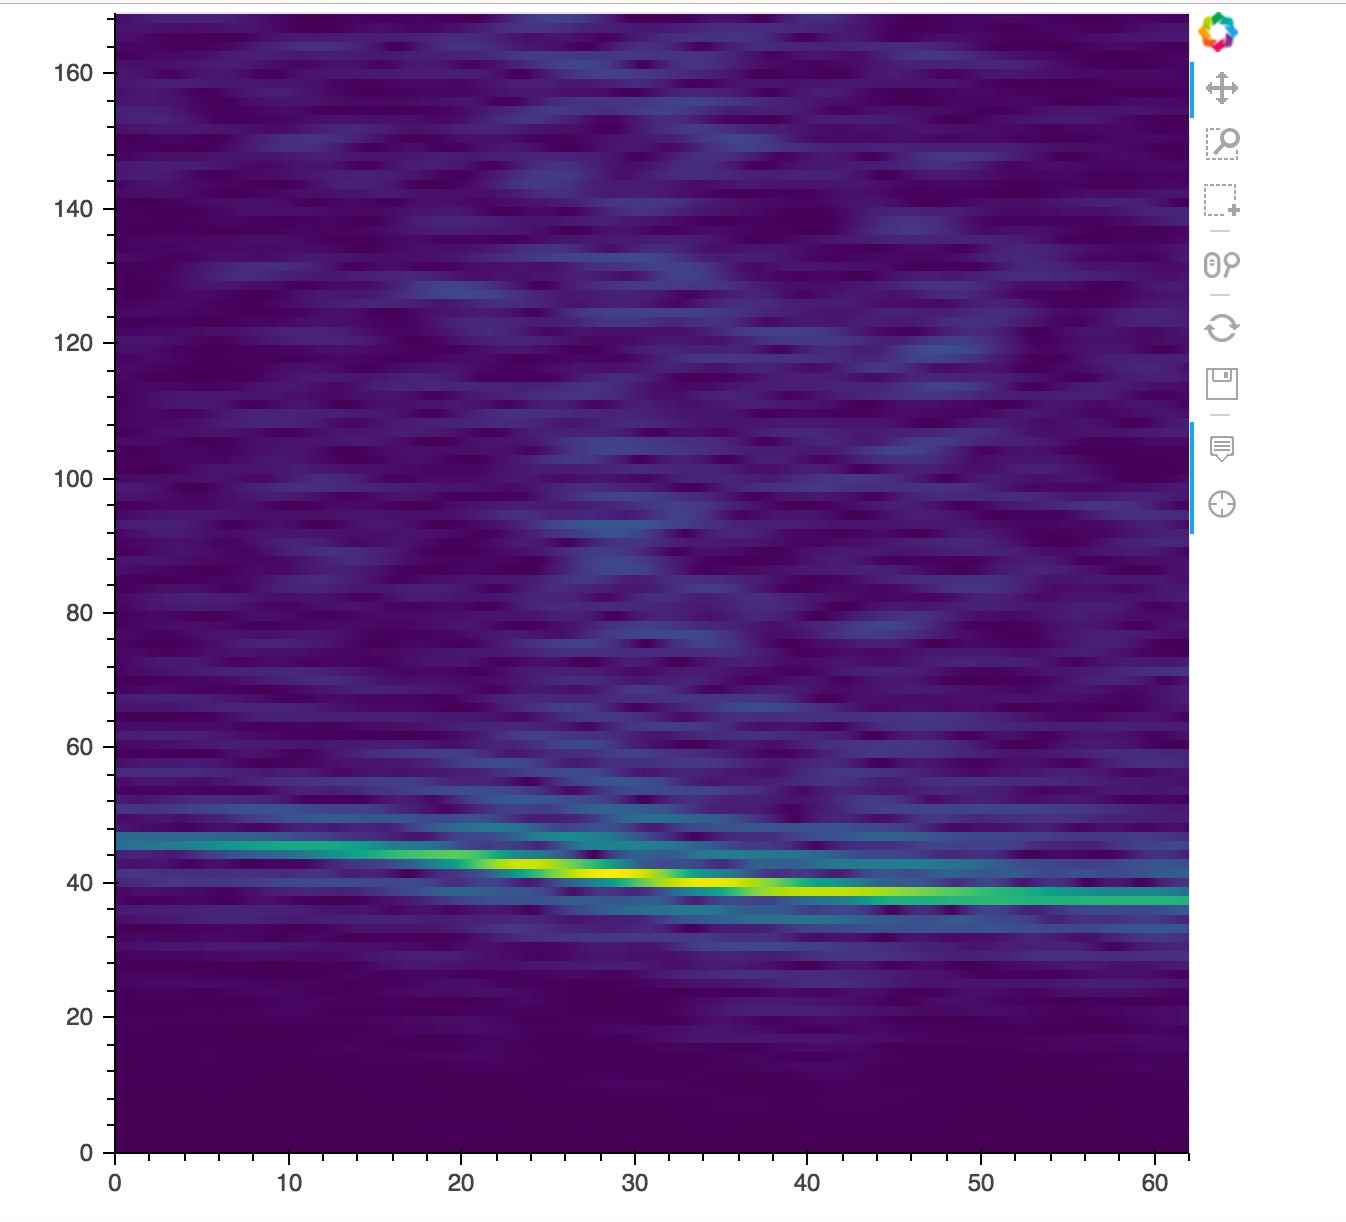
在经过短时傅里叶变换输出的结果,可以用 image 来显示时频分布图。与 Matlab 画出来的也是如出一辙。
import numpy as np
import pandas as pd
from bokeh.io import output_file, show
from bokeh.plotting import figure
data = pd.read_csv('tf_stft.csv')
value = np.array(data['value'])
d = np.reshape(value, (338, 124))
d = np.transpose(d)
TOOLS = "hover,crosshair,pan,wheel_zoom,box_zoom,reset,save,box_select"
p = figure(x_range=(0, 62), y_range=(0, 169), tools=TOOLS)
p.image(image=[d], x=0, y=0, dw=62, dh=169, palette="Viridis256")
output_file("image.html", title="image.py example")
show(p)
结果如下:

上述就是小编为大家分享的怎么在Django中使用Bokeh实现数据可视化了,如果刚好有类似的疑惑,不妨参照上述分析进行理解。如果想知道更多相关知识,欢迎关注亿速云行业资讯频道。
免责声明:本站发布的内容(图片、视频和文字)以原创、转载和分享为主,文章观点不代表本网站立场,如果涉及侵权请联系站长邮箱:is@yisu.com进行举报,并提供相关证据,一经查实,将立刻删除涉嫌侵权内容。