жӮЁеҘҪпјҢзҷ»еҪ•еҗҺжүҚиғҪдёӢи®ўеҚ•е“ҰпјҒ
еҜҶз Ғзҷ»еҪ•
зҷ»еҪ•жіЁеҶҢ
зӮ№еҮ» зҷ»еҪ•жіЁеҶҢ еҚіиЎЁзӨәеҗҢж„ҸгҖҠдәҝйҖҹдә‘з”ЁжҲ·жңҚеҠЎжқЎж¬ҫгҖӢ
иҝҷзҜҮж–Үз« дё»иҰҒд»Ӣз»ҚJointJS JavaScriptжөҒзЁӢеӣҫз»ҳеҲ¶жЎҶжһ¶зҡ„зӨәдҫӢеҲҶжһҗпјҢж–Үдёӯд»Ӣз»Қзҡ„йқһеёёиҜҰз»ҶпјҢе…·жңүдёҖе®ҡзҡ„еҸӮиҖғд»·еҖјпјҢж„ҹе…ҙи¶Јзҡ„е°Ҹдјҷдјҙ们дёҖе®ҡиҰҒзңӢе®ҢпјҒ
JointJSпјҡJavaScript жөҒзЁӢеӣҫз»ҳеҲ¶жЎҶжһ¶
жңҖиҝ‘и°ғз ”дәҶjsз”»жөҒзЁӢеӣҫзҡ„жЎҶжһ¶пјҢжңҖеҗҺйҖүжӢ©дәҶJointгҖӮй…ҚеҗҲдёҠ dagre еҸҜд»Ҙз”»еҮәеғҸжЁЎеғҸж ·зҡ„жөҒзЁӢеӣҫгҖӮ
JointJS з®Җд»Ӣ
JointJS жҳҜдёҖдёӘејҖжәҗеүҚз«ҜжЎҶжһ¶пјҢж”ҜжҢҒз»ҳеҲ¶еҗ„з§Қеҗ„ж ·зҡ„жөҒзЁӢеӣҫгҖҒе·ҘдҪңжөҒеӣҫзӯүгҖӮRappid жҳҜ Joint зҡ„е•ҶдёҡзүҲпјҢжҸҗдҫӣдәҶдёҖдәӣжӣҙејәзҡ„жҸ’件гҖӮJointJS зҡ„зү№зӮ№жңүдёӢйқўеҮ жқЎпјҢж‘ҳиҮӘе®ҳзҪ‘пјҡ
иғҪеӨҹе®һж—¶ең°жёІжҹ“дёҠзҷҫпјҲжҲ–иҖ…дёҠеҚғпјүдёӘе…ғзҙ е’ҢиҝһжҺҘ
ж”ҜжҢҒеӨҡз§ҚеҪўзҠ¶пјҲзҹ©еҪўгҖҒеңҶгҖҒж–Үжң¬гҖҒеӣҫеғҸгҖҒи·Ҝеҫ„зӯүпјү
й«ҳеәҰдәӢ件й©ұеҠЁпјҢз”ЁжҲ·еҸҜиҮӘе®ҡд№үд»»дҪ•еҸ‘з”ҹеңЁ paper дёӢзҡ„дәӢ件е“Қеә”
е…ғзҙ й—ҙиҝһжҺҘз®ҖеҚ•
еҸҜе®ҡеҲ¶зҡ„иҝһжҺҘе’Ңе…ізі»еӣҫ
иҝһжҺҘе№іж»‘пјҲеҹәдәҺиҙқеЎһе°”жҸ’еҖј bezier interpolationпјү& жҷәиғҪи·Ҝеҫ„йҖүжӢ©
еҹәдәҺ SVG зҡ„еҸҜе®ҡеҲ¶гҖҒеҸҜзј–зЁӢзҡ„еӣҫеҪўжёІжҹ“
NodeJS ж”ҜжҢҒ
йҖҡиҝҮ JSON иҝӣиЎҢеәҸеҲ—еҢ–е’ҢеҸҚеәҸеҲ—еҢ–
жҖ»д№Ӣ JoingJS жҳҜдёҖж¬ҫеҫҲејәзҡ„жөҒзЁӢеӣҫеҲ¶дҪңжЎҶжһ¶пјҢејҖжәҗзүҲжң¬е·Із»Ҹи¶іеӨҹж—ҘеёёдҪҝз”ЁдәҶгҖӮ
дёҖдәӣеёёз”Ёең°еқҖпјҡ
API: https://resources.jointjs.com/docs/jointjs/v1.1/joint.html
Tutorials: https://resources.jointjs.com/tutorial
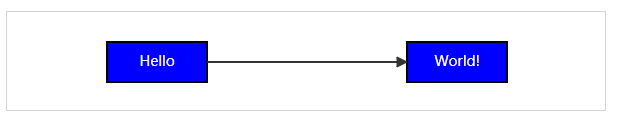
JointJS Hello world
<!DOCTYPE html> <html> <head> <link rel="stylesheet" type="text/css" href="https://cdnjs.cloudflare.com/ajax/libs/jointjs/2.1.0/joint.css" rel="external nofollow" rel="external nofollow" rel="external nofollow" /> </head> <body> <!-- content --> <div id="myholder"></div> <!-- dependencies йҖҡиҝҮCDNеҠ иҪҪдҫқиө–--> <script src="https://cdnjs.cloudflare.com/ajax/libs/jquery/3.1.1/jquery.js"></script> <script src="https://cdnjs.cloudflare.com/ajax/libs/lodash.js/3.10.1/lodash.js"></script> <script src="https://cdnjs.cloudflare.com/ajax/libs/backbone.js/1.3.3/backbone.js"></script> <script src="https://cdnjs.cloudflare.com/ajax/libs/jointjs/2.1.0/joint.js"></script> <!-- code --> <script type="text/javascript"> var graph = new joint.dia.Graph; var paper = new joint.dia.Paper({ el: document.getElementById('myholder'), model: graph, width: 600, height: 100, gridSize: 1 }); var rect = new joint.shapes.standard.Rectangle(); rect.position(100, 30); rect.resize(100, 40); rect.attr({ body: { fill: 'blue' }, label: { text: 'Hello', fill: 'white' } }); rect.addTo(graph); var rect2 = rect.clone(); rect2.translate(300, 0); rect2.attr('label/text', 'World!'); rect2.addTo(graph); var link = new joint.shapes.standard.Link(); link.source(rect); link.target(rect2); link.addTo(graph); </script> </body> </html>
hello world д»Јз ҒжІЎд»Җд№ҲеҘҪиҜҙзҡ„гҖӮиҰҒжіЁж„ҸиҝҷйҮҢзҡ„еӣҫеҪўе№¶жІЎжңүиҮӘеҠЁжҺ’зүҲпјҢиҖҢжҳҜйҖҡиҝҮ移еҠЁз¬¬дәҢдёӘ rect е®һзҺ°зҡ„жүӢеҠЁжҺ’зүҲгҖӮ
еүҚеҗҺз«ҜеҲҶзҰ»жһ¶жһ„
既然ж”ҜжҢҒ NodeJsпјҢйӮЈе°ұеҸҜд»ҘжҠҠз№ҒйҮҚзҡ„еӣҫеҪўз»ҳеҲ¶д»»еҠЎдәӨз»ҷжңҚеҠЎеҷЁпјҢеҶҚйҖҡиҝҮ JSON еәҸеҲ—еҢ–еңЁ HTTP дёҠдј иҫ“еҜ№иұЎпјҢиҝҷж ·еҮҸиҪ»е®ўжҲ·з«Ҝзҡ„еҺӢеҠӣгҖӮ
NodeJS еҗҺз«Ҝ
var express = require('express');
var joint = require('jointjs');

var app = express();

function get_graph(){
  var graph = new joint.dia.Graph();

  var rect = new joint.shapes.standard.Rectangle();
  rect.position(100, 30);
  rect.resize(100, 40);
  rect.attr({
    body: {
      fill: 'blue'
    },
    label: {
      text: 'Hello',
      fill: 'white'
    }
  });
  rect.addTo(graph);

  var rect2 = rect.clone();
  rect2.translate(300, 0);
  rect2.attr('label/text', 'World!');
  rect2.addTo(graph);

  var link = new joint.shapes.standard.Link();
  link.source(rect);
  link.target(rect2);
  link.addTo(graph);

  return graph.toJSON();
}

app.all('*', function(req, res, next) {
  res.header("Access-Control-Allow-Origin", "*");
  res.header("Access-Control-Allow-Headers", "X-Requested-With");
  res.header("Access-Control-Allow-Methods","PUT,POST,GET,DELETE,OPTIONS");
  next();
});

app.get('/graph', function(req, res){
  console.log('[+] send graph json to client')
  res.send(get_graph());
});
app.listen(8071);
HTML еүҚз«Ҝ
<!DOCTYPE html>
<html>
<head>
<link rel="stylesheet" type="text/css" href="https://cdnjs.cloudflare.com/ajax/libs/jointjs/2.1.0/joint.css" rel="external nofollow" rel="external nofollow" rel="external nofollow" />
</head>
<body>
<!-- content -->
<div id="myholder"></div>
<!-- dependencies йҖҡиҝҮCDNеҠ иҪҪдҫқиө–-->
<script src="https://cdnjs.cloudflare.com/ajax/libs/jquery/3.1.1/jquery.js"></script>
<script src="https://cdnjs.cloudflare.com/ajax/libs/lodash.js/3.10.1/lodash.js"></script>
<script src="https://cdnjs.cloudflare.com/ajax/libs/backbone.js/1.3.3/backbone.js"></script>
<script src="https://cdnjs.cloudflare.com/ajax/libs/jointjs/2.1.0/joint.js"></script>
<!-- code -->
<script type="text/javascript">
var graph = new joint.dia.Graph;
var paper = new joint.dia.Paper({
el: document.getElementById('myholder'),
model: graph,
width: 600,
height: 100,
gridSize: 1
});
$.get('http://192.168.237.128:8071/graph', function(data, statue){
graph.fromJSON(data);
});
</script>
</body>
</html>е…¶д»–
иҮӘеҠЁеёғеұҖ Automatic layout
JointJS еҶ…зҪ®дәҶжҸ’件иҝӣиЎҢиҮӘеҠЁжҺ’зүҲпјҢеҺҹзҗҶжҳҜи°ғз”Ё Dagre еә“гҖӮе®ҳж–№ api дёӯжңүж ·дҫӢгҖӮ
дҪҝз”Ёж–№жі•пјҡ
var graphBBox = joint.layout.DirectedGraph.layout(graph, {
nodeSep: 50,
edgeSep: 80,
rankDir: "TB"
});| й…ҚзҪ®еҸӮж•° | жіЁйҮҠ |
|---|---|
| nodeSep | зӣёеҗҢrankзҡ„йӮ»жҺҘиҠӮзӮ№зҡ„и·қзҰ» |
| edgeSep | зӣёеҗҢrankзҡ„йӮ»жҺҘиҫ№зҡ„и·қзҰ» |
| rankSep | дёҚеҗҢ rank е…ғзҙ д№Ӣй—ҙзҡ„и·қзҰ» |
| rankDir | еёғеұҖж–№еҗ‘ ( "TB" (top-to-bottom) / "BT" (bottom-to-top) / "LR" (left-to-right) / "RL"(right-to-left)) |
| marginX | number of pixels to use as a margin around the left and right of the graph. |
| marginY | number of pixels to use as a margin around the top and bottom of the graph. |
| ranker | жҺ’еәҸз®—жі•гҖӮ Possible values: 'network-simplex' (default), 'tight-tree' or 'longest-path'. |
| resizeClusters | set to false if you don't want parent elements to stretch in order to fit all their embedded children. Default is true. |
| clusterPadding | A gap between the parent element and the boundary of its embedded children. It could be a number or an object e.g. { left: 10, right: 10, top: 30, bottom: 10 }. It defaults to 10. |
| setPosition(element, position) | a function that will be used to set the position of elements at the end of the layout. This is useful if you don't want to use the default element.set('position', position) but want to set the position in an animated fashion via transitions. |
| setVertices(link, vertices) | If set to true the layout will adjust the links by setting their vertices. It defaults to false. If the option is defined as a function it will be used to set the vertices of links at the end of the layout. This is useful if you don't want to use the default link.set('vertices', vertices) but want to set the vertices in an animated fashion via transitions. |
| setLabels(link, labelPosition, points) | If set to true the layout will adjust the labels by setting their position. It defaults to false. If the option is defined as a function it will be used to set the labels of links at the end of the layout. Note: Only the first label (link.label(0);) is positioned by the layout. |
| dagre | й»ҳи®Өжғ…еҶөдёӢпјҢdagre еә”иҜҘеңЁе…ЁеұҖе‘ҪеҗҚз©әй—ҙеҪ“дёӯпјҢдёҚиҝҮдҪ д№ҹеҸҜд»ҘеҪ“дҪңеҸӮж•°дј иҝӣеҺ» |
| graphlib | й»ҳи®Өжғ…еҶөдёӢпјҢgraphlib еә”иҜҘеңЁе…ЁеұҖе‘ҪеҗҚз©әй—ҙеҪ“дёӯпјҢдёҚиҝҮдҪ д№ҹеҸҜд»ҘеҪ“дҪңеҸӮж•°дј иҝӣеҺ» |
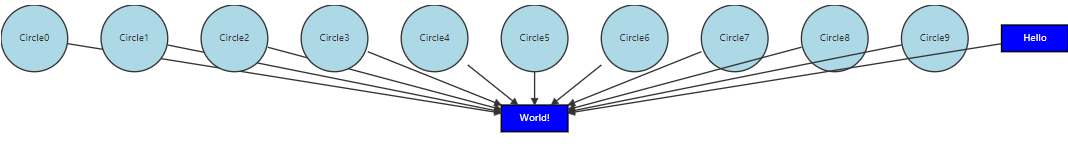
жҲ‘们жқҘиҜ•дёҖдёӢгҖӮNodeJS еҗҺз«Ҝ
var express = require('express');
var joint = require('jointjs');
var dagre = require('dagre')
var graphlib = require('graphlib');
var app = express();
function get_graph(){
  var graph = new joint.dia.Graph();
  var rect = new joint.shapes.standard.Rectangle();
  rect.position(100, 30);
  rect.resize(100, 40);
  rect.attr({
    body: {
      fill: 'blue'
    },
    label: {
      text: 'Hello',
      fill: 'white'
    }
  });
  rect.addTo(graph);
  var rect2 = rect.clone();
  rect2.translate(300, 0);
  rect2.attr('label/text', 'World!');
  rect2.addTo(graph);
  for(var i=0; i<10; i++){
    var cir = new joint.shapes.standard.Circle();
    cir.resize(100, 100);
    cir.position(10, 10);
    cir.attr('root/title', 'joint.shapes.standard.Circle');
    cir.attr('label/text', 'Circle' + i);
    cir.attr('body/fill', 'lightblue');
    cir.addTo(graph);
    var ln = new joint.shapes.standard.Link();
    ln.source(cir);
    ln.target(rect2);
    ln.addTo(graph);
  }
  var link = new joint.shapes.standard.Link();
  link.source(rect);
  link.target(rect2);
  link.addTo(graph);
  //auto layout
  joint.layout.DirectedGraph.layout(graph, {
    nodeSep: 50,
    edgeSep: 50,
    rankDir: "TB",
    dagre: dagre,
    graphlib: graphlib
  });
  return graph.toJSON();
}
app.all('*', function(req, res, next) {
  res.header("Access-Control-Allow-Origin", "*");
  res.header("Access-Control-Allow-Headers", "X-Requested-With");
  res.header("Access-Control-Allow-Methods","PUT,POST,GET,DELETE,OPTIONS");
  next();
});
app.get('/graph', function(req, res){
  console.log('[+] send graph json to client')
  res.send(get_graph());
});
app.listen(8071);
HTML еүҚз«Ҝ
<!DOCTYPE html>
<html>
<head>
<link rel="stylesheet" type="text/css" href="https://cdnjs.cloudflare.com/ajax/libs/jointjs/2.1.0/joint.css" rel="external nofollow" rel="external nofollow" rel="external nofollow" />
</head>
<body>
<!-- content -->
<div id="myholder"></div>
<!-- dependencies йҖҡиҝҮCDNеҠ иҪҪдҫқиө–-->
<script src="https://cdnjs.cloudflare.com/ajax/libs/jquery/3.1.1/jquery.js"></script>
<script src="https://cdnjs.cloudflare.com/ajax/libs/lodash.js/3.10.1/lodash.js"></script>
<script src="https://cdnjs.cloudflare.com/ajax/libs/backbone.js/1.3.3/backbone.js"></script>
<script src="https://cdnjs.cloudflare.com/ajax/libs/jointjs/2.1.0/joint.js"></script>
<!-- code -->
<script type="text/javascript">
var graph = new joint.dia.Graph;
var paper = new joint.dia.Paper({
el: document.getElementById('myholder'),
model: graph,
width: 2000,
height: 2000,
gridSize: 1
});
$.get('http://192.168.237.128:8071/graph', function(data, statue){
graph.fromJSON(data);
});
</script>
</body>
</html>з»“жһңпјҡ
дҪҝз”Ё HTML е®ҡеҲ¶е…ғзҙ
жөҒзЁӢеӣҫдёӯзҡ„жҜҸдёӘзӮ№пјҢд№ҹе°ұжҳҜжҳҜе…ғзҙ пјҢйғҪеҸҜд»ҘиҮӘе®ҡд№үпјҢзӣҙжҺҘзј–еҶҷ html д»Јз ҒиғҪж·»еҠ жҢүй’®гҖҒиҫ“е…ҘжЎҶгҖҒд»Јз Ғеқ—зӯүгҖӮ
жҲ‘зҡ„дёҖдёӘд»Јз Ғеқ— demoпјҢжҗӯй…Қ highlight.js еҸҜд»ҘиҫҫеҲ°зұ»дјј IDA жҺ§еҲ¶жөҒеӣҫзҡ„ж•ҲжһңгҖӮиҝҷдёӘ feature еҸҜзҺ©еәҰеҫҲй«ҳгҖӮ
joint.shapes.BBL = {};
joint.shapes.BBL.Element = joint.shapes.basic.Rect.extend({
  defaults: joint.util.deepSupplement({
    type: 'BBL.Element',
    attrs: {
      rect: { stroke: 'none', 'fill-opacity': 0 }
    }
  }, joint.shapes.basic.Rect.prototype.defaults)
});

// Create a custom view for that element that displays an HTML div above it.
// -------------------------------------------------------------------------
joint.shapes.BBL.ElementView = joint.dia.ElementView.extend({
  template: [
    '<div class="html-element" data-collapse>',
    '<label></label><br/>',
    '<div class="hljs"><pre><code></code></pre></span></div>',
    '</div>'
  ].join(''),

  initialize: function() {
    _.bindAll(this, 'updateBox');
    joint.dia.ElementView.prototype.initialize.apply(this, arguments);

    this.$box = $(_.template(this.template)());
    // Prevent paper from handling pointerdown.
    this.$box.find('h4').on('mousedown click', function(evt) {
      evt.stopPropagation();
    });

    // Update the box position whenever the underlying model changes.
    this.model.on('change', this.updateBox, this);
    // Remove the box when the model gets removed from the graph.
    this.model.on('remove', this.removeBox, this);

    this.updateBox();
  },
  render: function() {
    joint.dia.ElementView.prototype.render.apply(this, arguments);
    this.paper.$el.prepend(this.$box);
    this.updateBox();
    return this;
  },
  updateBox: function() {
  // Set the position and dimension of the box so that it covers the JointJS element.
    var bbox = this.model.getBBox();
    // Example of updating the HTML with a data stored in the cell model.
    this.$box.find('label').text(this.model.get('label'));
    this.$box.find('code').html(this.model.get('code'));
    var color = this.model.get('color');
    this.$box.css({
      width: bbox.width,
      height: bbox.height,
      left: bbox.x,
      top: bbox.y,
      background: color,
      "border-color": color
    });
  },
  removeBox: function(evt) {
    this.$box.remove();
  }
});д»ҘдёҠжҳҜвҖңJointJS JavaScriptжөҒзЁӢеӣҫз»ҳеҲ¶жЎҶжһ¶зҡ„зӨәдҫӢеҲҶжһҗвҖқиҝҷзҜҮж–Үз« зҡ„жүҖжңүеҶ…е®№пјҢж„ҹи°ўеҗ„дҪҚзҡ„йҳ…иҜ»пјҒеёҢжңӣеҲҶдә«зҡ„еҶ…е®№еҜ№еӨ§е®¶жңүеё®еҠ©пјҢжӣҙеӨҡзӣёе…ізҹҘиҜҶпјҢж¬ўиҝҺе…іжіЁдәҝйҖҹдә‘иЎҢдёҡиө„и®Ҝйў‘йҒ“пјҒ
е…ҚиҙЈеЈ°жҳҺпјҡжң¬з«ҷеҸ‘еёғзҡ„еҶ…е®№пјҲеӣҫзүҮгҖҒи§Ҷйў‘е’Ңж–Үеӯ—пјүд»ҘеҺҹеҲӣгҖҒиҪ¬иҪҪе’ҢеҲҶдә«дёәдё»пјҢж–Үз« и§ӮзӮ№дёҚд»ЈиЎЁжң¬зҪ‘з«ҷз«ӢеңәпјҢеҰӮжһңж¶үеҸҠдҫөжқғиҜ·иҒ”зі»з«ҷй•ҝйӮ®з®ұпјҡis@yisu.comиҝӣиЎҢдёҫжҠҘпјҢ并жҸҗдҫӣзӣёе…іиҜҒжҚ®пјҢдёҖз»ҸжҹҘе®һпјҢе°Ҷз«ӢеҲ»еҲ йҷӨж¶үе«ҢдҫөжқғеҶ…е®№гҖӮ
жӮЁеҘҪпјҢзҷ»еҪ•еҗҺжүҚиғҪдёӢи®ўеҚ•е“ҰпјҒ