您好,登录后才能下订单哦!
密码登录
登录注册
点击 登录注册 即表示同意《亿速云用户服务条款》
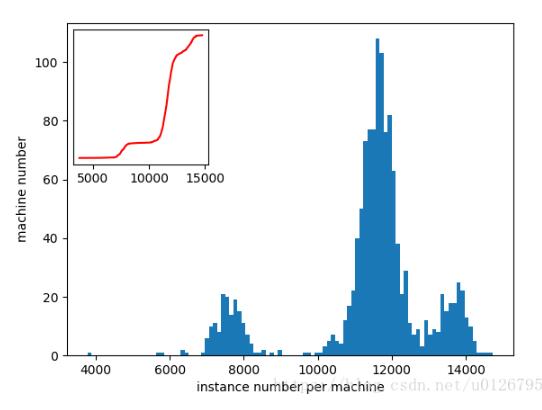
有时候为了直观展现图的信息,可以在大图中添加小子图的方式进行数据分析,如下图所示:

具体的代码如下:该图连接了数据库,当然重要的不是数据展示,而是添加子图的方法。
import matplotlib.pyplot as plt
import MySQLdb as mdb
import numpy as np
from mpl_toolkits.axes_grid1.inset_locator import inset_axes
from mpl_toolkits.axes_grid1.inset_locator import mark_inset


def graph():
  # 连接数据库
  conn = mdb.connect(host='127.0.0.1', port=3306, user='root', passwd='root', db='alibaba_trace', charset='utf8')

  # 如果使用事务引擎,可以设置自动提交事务,或者在每次操作完成后手动提交事务conn.commit()
  conn.autocommit(1) # conn.autocommit(True)

  # 使用cursor()方法获取操作游标
  cursor = conn.cursor()
  # 因该模块底层其实是调用CAPI的,所以,需要先得到当前指向数据库的指针。
  try:
    cursor.execute("select machineID, count(id) from batch_instance where machineID != 0 group by machineID")
    records = cursor.fetchall()
    list_records = list(records)

  except:
    import traceback
    traceback.print_exc()
    # 发生错误时回滚
    conn.rollback()
  finally:
    # 关闭游标连接
    cursor.close()
    # 关闭数据库连接
    conn.close()

  res = []
  res[:] = map(list, list_records)
  machineID = [x[0] for x in res]
  instance_num = [x[1] for x in res]
  print(max(instance_num))
  print(min(instance_num))


  fig = plt.figure()
  ax1 = fig.add_subplot(1, 1, 1)
  # # cdf
  # hist, bin_edges = np.histogram(instance_num, bins=len(np.unique(instance_num)))
  # cdf = np.cumsum(hist / sum(hist))
  # ax1.plot(bin_edges[1:], cdf, color='red', ls='-')
  # ax1.set_xlabel("instance number per machine")
  # ax1.set_ylabel("portion of machine")
  # plt.savefig('../../imgs_mysql/cdf_of_machine_instance.png')

  # # 直方图
  ax1.hist(instance_num, normed=False, alpha=1.0, bins=100)
  ax1.set_xlabel('instance number per machine')
  ax1.set_ylabel('machine number')
  # cdf 要添加的子图
  axins = inset_axes(ax1, width=1.5, height=1.5, loc='upper left')
  # ax1 大图
  # width height分别为子图的宽和高
  # loc 为子图在大图ax1中的相对位置 相应的值有
  # upper left
  # lower left
  # lower right
  # right
  # center left
  # center right
  # lower center
  # upper center
  # center
  hist, bin_edges = np.histogram(instance_num, bins=len(np.unique(instance_num)))
  cdf = np.cumsum(hist / sum(hist))
  axins.plot(bin_edges[1:], cdf, color='red', ls='-')
  axins.set_yticks([])
  # axins.set_xlabel("instance number per machine")
  # axins.set_ylabel("portion of machine")

  plt.savefig("../../imgs_mysql/hist_of_machine_instance")
  plt.show()

if __name__ == '__main__':
  graph()
以上这篇python 实现在一张图中绘制一个小的子图方法就是小编分享给大家的全部内容了,希望能给大家一个参考,也希望大家多多支持亿速云。
免责声明:本站发布的内容(图片、视频和文字)以原创、转载和分享为主,文章观点不代表本网站立场,如果涉及侵权请联系站长邮箱:is@yisu.com进行举报,并提供相关证据,一经查实,将立刻删除涉嫌侵权内容。