жӮЁеҘҪпјҢзҷ»еҪ•еҗҺжүҚиғҪдёӢи®ўеҚ•е“ҰпјҒ
иҝҷжңҹеҶ…е®№еҪ“дёӯе°Ҹзј–е°Ҷдјҡз»ҷеӨ§е®¶еёҰжқҘжңүе…іжҖҺд№ҲеңЁPythonдёӯдҪҝз”ЁMatplotlibе®һзҺ°дёҖдёӘдёүз»ҙж•°жҚ®зҡ„ж•ЈзӮ№еӣҫпјҢж–Үз« еҶ…е®№дё°еҜҢдё”д»Ҙдё“дёҡзҡ„и§’еәҰдёәеӨ§е®¶еҲҶжһҗе’ҢеҸҷиҝ°пјҢйҳ…иҜ»е®ҢиҝҷзҜҮж–Үз« еёҢжңӣеӨ§е®¶еҸҜд»ҘжңүжүҖ收иҺ·гҖӮ
PythonжҳҜдёҖз§Қи·Ёе№іеҸ°зҡ„гҖҒе…·жңүи§ЈйҮҠжҖ§гҖҒзј–иҜ‘жҖ§гҖҒдә’еҠЁжҖ§е’Ңйқўеҗ‘еҜ№иұЎзҡ„и„ҡжң¬иҜӯиЁҖпјҢе…¶жңҖеҲқзҡ„и®ҫи®ЎжҳҜз”ЁдәҺзј–еҶҷиҮӘеҠЁеҢ–и„ҡжң¬пјҢйҡҸзқҖзүҲжң¬зҡ„дёҚж–ӯжӣҙж–°е’Ңж–°еҠҹиғҪзҡ„ж·»еҠ пјҢеёёз”ЁдәҺз”ЁдәҺејҖеҸ‘зӢ¬з«Ӣзҡ„йЎ№зӣ®е’ҢеӨ§еһӢйЎ№зӣ®гҖӮ
е®һзҺ°иҝҮзЁӢ
е…¶дёӯе°ұжңүжҲ‘们йңҖиҰҒеҸӮиҖғзҡ„йғЁеҲҶпјҢд№ҹе°ұжҳҜmplot3d example code : 2dcollections3d_demo.pyгҖӮдёӢйқўиҙҙеҮәе…¶дёӯзҡ„д»Јз Ғж®өгҖӮ гҖҖгҖҖ
from mpl_toolkits.mplot3d import Axes3D
import numpy as np
import matplotlib.pyplot as plt

fig = plt.figure()
ax = fig.gca(projection='3d')

# Plot a sin curve using the x and y axes.
x = np.linspace(0, 1, 100)
y = np.sin(x * 2 * np.pi) / 2 + 0.5
ax.plot(x, y, zs=0, zdir='z', label='curve in (x,y)')

# Plot scatterplot data (20 2D points per colour) on the x and z axes.
colors = ('r', 'g', 'b', 'k')
x = np.random.sample(20*len(colors))
y = np.random.sample(20*len(colors))
c_list = []
for c in colors:
 c_list.append([c]*20)
# By using zdir='y', the y value of these points is fixed to the zs value 0
# and the (x,y) points are plotted on the x and z axes.
ax.scatter(x, y, zs=0, zdir='y', c=c_list, label='points in (x,z)')

# Make legend, set axes limits and labels
ax.legend()
ax.set_xlim(0, 1)
ax.set_ylim(0, 1)
ax.set_zlim(0, 1)
ax.set_xlabel('X')
ax.set_ylabel('Y')
ax.set_zlabel('Z')

# Customize the view angle so it's easier to see that the scatter points lie
# on the plane y=0
ax.view_init(elev=20., azim=-35)

plt.show()ж ·дҫӢзҡ„иҝҗиЎҢз»“жһңеӨ§иҮҙеҰӮдёӢпјҡ

йҰ–е…Ҳж ·дҫӢзҡ„ж•°жҚ®жқҘиҮӘдәҺйҡҸжңәж•°зҡ„дә§з”ҹпјҢдҪҶжҳҜеңЁжҲ‘е®һйҷ…дҪҝз”Ёзҡ„иҝҮзЁӢдёӯпјҢж•°жҚ®жҳҜйңҖиҰҒйў„е…ҲеӯҳеӮЁдёҺеҜје…Ҙзҡ„гҖӮеӣ жӯӨжҲ‘ж·»еҠ ж•°жҚ®еҜје…ҘйғЁеҲҶпјҡ
import scipy.io as sio
#get the data form F:\matlab.mat
data = sio.loadmat('F:\matlab.mat')
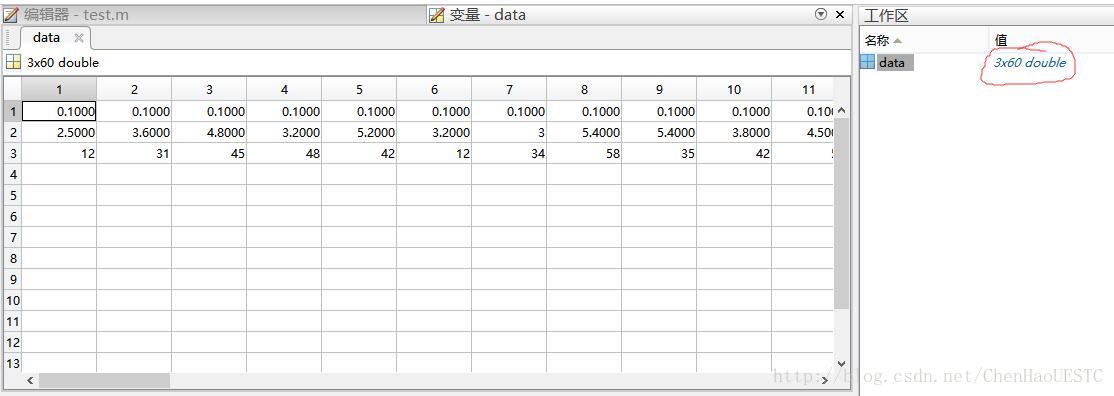
m = data['data']еҖјеҫ—дёҖжҸҗзҡ„жҳҜиҝҷеҸӘжҳҜжҲ‘жөӢиҜ•зҡ„ж•°жҚ®пјҢеңЁе®һйҷ…еә”з”ЁиҝҮзЁӢдёӯпјҢж•°жҚ®зҡ„ж јејҸжҳҜеӨҡз§ҚеӨҡж ·зҡ„пјҢжүҖд»ҘйңҖиҰҒеҒҡж•°жҚ®ж јејҸиҪ¬еҢ–зҡ„жЁЎеқ—гҖӮеҗҢж—¶йҮҮз”Ё.matж•°жҚ®зҡ„ж јејҸпјҢз”ЁжҲ·еҸҜд»Ҙз”Ёmatlabжү“ејҖпјҢ并еҜ№ж•°жҚ®иҝӣиЎҢжӣҙж”№д№Ӣзұ»зҡ„ж“ҚдҪңгҖӮйҮҮз”Ёиҝҷз§Қж–№жі•еҜје…ҘеҗҺпјҢдјҡиҮӘеҠЁеҪўжҲҗж•°з»„гҖӮ

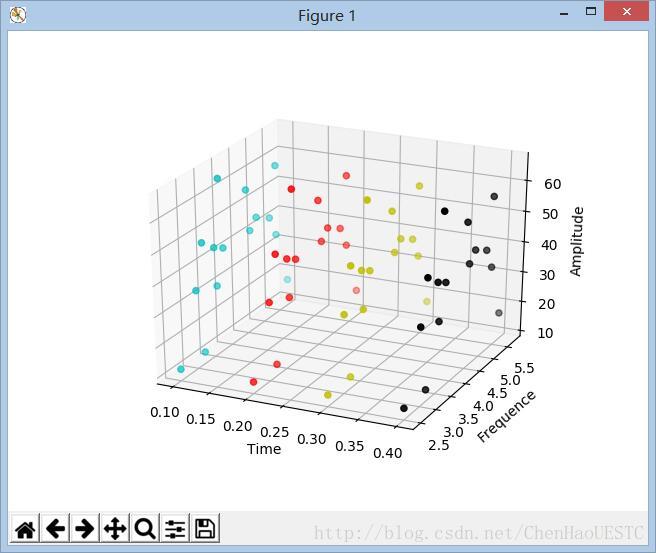
еҰӮдёҠеӣҫжүҖзӨәпјҢжҳҜж•°жҚ®еңЁmatlabдёӯжү“ејҖзҡ„еҪўејҸпјҢеӣ дёәжҲ‘们йңҖиҰҒз”»еҮәдёүз»ҙж•ЈзӮ№еӣҫпјҢдјҡиҮӘеҠЁдә§з”ҹ3Г—60зҡ„ж•°з»„пјҢжҜҸиЎҢд»ЈиЎЁжҜҸдёҖз»ҙзҡ„ж•°жҚ®гҖӮиҙҙдёҖеј еҒҡеҮәзҡ„Demoзҡ„жҲҗжһңеӣҫпјҡ гҖҖгҖҖ


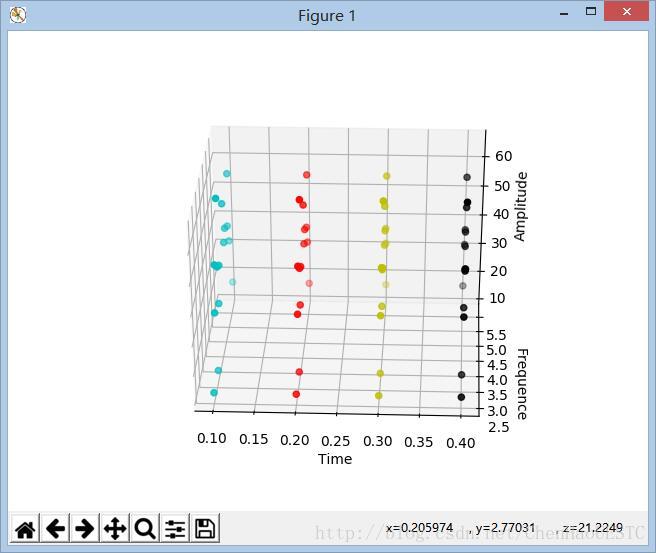
еӣ дёәжҲ‘жҳҜз”ЁTimeеҸҳйҮҸеҒҡдёәXlabelпјҢеҗҢж—¶жЁЎжӢҹж•°жҚ®жҳҜзӯүж—¶й—ҙй—ҙи·қиҝӣиЎҢйҮҮж ·зҡ„пјҢеҗҢж—¶жғіиҰҒеңЁдёҚеҗҢзҡ„ж—¶й—ҙзӮ№йҮҮз”ЁдёҚеҗҢзҡ„йўңиүІгҖӮеӣ жӯӨйңҖиҰҒеҜ№ax.scatter(x,y,z,c)дёӯзҡ„cеҸҳйҮҸиҝӣиЎҢжӣҙж”№пјҢеҸҜд»Ҙз”ЁеҸҳйҮҸд»ЈжӣҝпјҢиҝҷж ·е°ұеҸҜд»Ҙз”ЁдёӘеҫӘзҺҜз»“жһ„е®һзҺ°йўңиүІзҡ„еҲҮжҚўеҠҹиғҪгҖӮ
for a in x:
 if a == 0.1:
  C.append('c')
 elif a == 0.2:
  C.append('r')
 elif a == 0.3:
  C.append('y')
 elif a == 0.4:
  C.append('k')
ax.scatter(x, y, z, c=C)йўңиүІеҲҮжҚўйғЁеҲҶд»Јз ҒеҰӮдёӢпјҡ
import scipy.io as sio
from mpl_toolkits.mplot3d import Axes3D
import matplotlib.pyplot as plt
import numpy as np

def Singleplot():
 data = sio.loadmat('F:\matlab.mat')
 m = data['data']

 x = m[0]
 y = m[1]
 z = m[2]

 C = []
 ax = plt.subplot(111, projection='3d')

 for a in x:
 if a == 0.1:
  C.append('c')
 elif a == 0.2:
  C.append('r')
 elif a == 0.3:
  C.append('y')
 elif a == 0.4:
  C.append('k')

 ax.scatter(x, y, z, c=C)

 ax.set_xlabel('Time')
 ax.set_ylabel('Frequence')
 ax.set_zlabel('Amplitude')

 plt.show()

singleplot()дёҠиҝ°е°ұжҳҜе°Ҹзј–дёәеӨ§е®¶еҲҶдә«зҡ„жҖҺд№ҲеңЁPythonдёӯдҪҝз”ЁMatplotlibе®һзҺ°дёҖдёӘдёүз»ҙж•°жҚ®зҡ„ж•ЈзӮ№еӣҫдәҶпјҢеҰӮжһңеҲҡеҘҪжңүзұ»дјјзҡ„з–‘жғ‘пјҢдёҚеҰЁеҸӮз…§дёҠиҝ°еҲҶжһҗиҝӣиЎҢзҗҶи§ЈгҖӮеҰӮжһңжғізҹҘйҒ“жӣҙеӨҡзӣёе…ізҹҘиҜҶпјҢж¬ўиҝҺе…іжіЁдәҝйҖҹдә‘иЎҢдёҡиө„и®Ҝйў‘йҒ“гҖӮ
е…ҚиҙЈеЈ°жҳҺпјҡжң¬з«ҷеҸ‘еёғзҡ„еҶ…е®№пјҲеӣҫзүҮгҖҒи§Ҷйў‘е’Ңж–Үеӯ—пјүд»ҘеҺҹеҲӣгҖҒиҪ¬иҪҪе’ҢеҲҶдә«дёәдё»пјҢж–Үз« и§ӮзӮ№дёҚд»ЈиЎЁжң¬зҪ‘з«ҷз«ӢеңәпјҢеҰӮжһңж¶үеҸҠдҫөжқғиҜ·иҒ”зі»з«ҷй•ҝйӮ®з®ұпјҡis@yisu.comиҝӣиЎҢдёҫжҠҘпјҢ并жҸҗдҫӣзӣёе…іиҜҒжҚ®пјҢдёҖз»ҸжҹҘе®һпјҢе°Ҷз«ӢеҲ»еҲ йҷӨж¶үе«ҢдҫөжқғеҶ…е®№гҖӮ
жӮЁеҘҪпјҢзҷ»еҪ•еҗҺжүҚиғҪдёӢи®ўеҚ•е“ҰпјҒ