жӮЁеҘҪпјҢзҷ»еҪ•еҗҺжүҚиғҪдёӢи®ўеҚ•е“ҰпјҒ
еҜҶз Ғзҷ»еҪ•
зҷ»еҪ•жіЁеҶҢ
зӮ№еҮ» зҷ»еҪ•жіЁеҶҢ еҚіиЎЁзӨәеҗҢж„ҸгҖҠдәҝйҖҹдә‘з”ЁжҲ·жңҚеҠЎжқЎж¬ҫгҖӢ
иҝҷзҜҮж–Үз« дё»иҰҒд»Ӣз»ҚдәҶPythonдёӯexcelе’ҢshpеҰӮдҪ•дҪҝз”ЁеңЁmatplotlibпјҢе…·жңүдёҖе®ҡеҖҹйүҙд»·еҖјпјҢж„ҹе…ҙи¶Јзҡ„жңӢеҸӢеҸҜд»ҘеҸӮиҖғдёӢпјҢеёҢжңӣеӨ§е®¶йҳ…иҜ»е®ҢиҝҷзҜҮж–Үз« д№ӢеҗҺеӨ§жңү收иҺ·пјҢдёӢйқўи®©е°Ҹзј–еёҰзқҖеӨ§е®¶дёҖиө·дәҶи§ЈдёҖдёӢгҖӮ
е…ідәҺexcelе’Ңshpзҡ„дҪҝз”ЁеңЁmatplotlib
дҪҝз”Ёpandas еҜ№excelиҝӣиЎҢз®ҖеҚ•ж“ҚдҪң
дҪҝз”Ёcartopy иҜ»еҸ–shpfile еұ•зӨәеҲ°matplotlibдёӯ
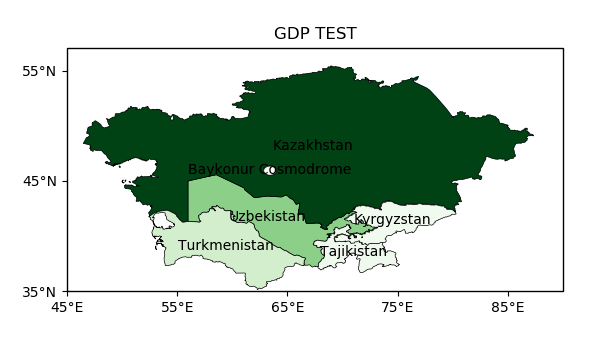
еҲ©з”Ёshpfileж–Ү件дёӯзҡ„дёҖдәӣеӯ—ж®өиҝӣиЎҢдёҖдәӣзқҖиүІеӨ„зҗҶ
#!/usr/bin/env python
# -*- coding: utf-8 -*-
# @File : map02.py
# @Author: huifer
# @Date : 2018/6/28
import folium
import pandas as pd
import requests
import matplotlib.pyplot as plt
import cartopy.crs as ccrs
import zipfile
import cartopy.io.shapereader as shaperead
from matplotlib import cm
from cartopy.mpl.ticker import LongitudeFormatter, LatitudeFormatter
import os
dataurl = "http://image.data.cma.cn/static/doc/A/A.0012.0001/SURF_CHN_MUL_HOR_STATION.xlsx"
shpurl = "http://www.naturalearthdata.com/http//www.naturalearthdata.com/download/10m/cultural/ne_10m_admin_0_countries.zip"
def download_file(url):
"""
ж №жҚ®urlдёӢиҪҪж–Ү件
:param url: str
"""
r = requests.get(url, allow_redirects=True)
try:
open(url.split('/')[-1], 'wb').write(r.content)
except Exception as e:
print(e)
def degree_conversion_decimal(x):
"""
еәҰеҲҶиҪ¬жҚўжҲҗеҚҒиҝӣеҲ¶
:param x: float
:return: integer float
"""
integer = int(x)
integer = integer + (x - integer) * 1.66666667
return integer
def unzip(zip_path, out_path):
"""
и§ЈеҺӢzip
:param zip_path:str
:param out_path: str
:return:
"""
zip_ref = zipfile.ZipFile(zip_path, 'r')
zip_ref.extractall(out_path)
zip_ref.close()
def get_record(shp, key, value):
countries = shp.records()
result = [country for country in countries if country.attributes[key] == value]
countries = shp.records()
return result
def read_excel(path):
data = pd.read_excel(path)
# print(data.head(10)) # иҺ·еҸ–еҮ иЎҢ
# print(data.ix[data['зңҒд»Ҫ']=='жөҷжұҹ',:].shape[0]) # и®Ўж•°е·Ҙе…·
# print(data.sort_values('и§ӮжөӢеңәжӢ”жө·й«ҳеәҰпјҲзұіпјү',ascending=False).head(10))# ж №жҚ®еҖјжҺ’еәҸ
# еҲӨж–ӯз»Ҹзә¬еәҰжҳҜд»Җд№Ҳж јејҸ(еәҰеҲҶ гҖҒ еҚҒиҝӣеҲ¶) еҲӨж–ӯдҫқжҚ® %0.2f жҳҜеҗҰеӨ§дәҺ60
# print(data['з»ҸеәҰ'].apply(lambda x:x-int(x)).sort_values(ascending=False).head()) # з»“жһңеҲӨж–ӯдёәеәҰеҲҶдҝқеӯҳ
# еқҗж ҮеӨ„зҗҶ
data['з»ҸеәҰ'] = data['з»ҸеәҰ'].apply(degree_conversion_decimal)
data['зә¬еәҰ'] = data['зә¬еәҰ'].apply(degree_conversion_decimal)
ax = plt.axes(projection=ccrs.PlateCarree())
ax.set_extent([70, 140, 15, 55])
ax.stock_img()
ax.scatter(data['з»ҸеәҰ'], data['зә¬еәҰ'], s=0.3, c='g')
# shp = shaperead.Reader('ne_10m_admin_0_countries/ne_10m_admin_0_countries.shp')
# # жҠҪеҸ–еҮҪж•° е·һпјҡеӣҪ家
# city_list = [country for country in countries if country.attributes['ADMIN'] == 'China']
# countries = shp.records()
plt.savefig('test.png')
plt.show()
def gdp(shp_path):
"""
GDP зқҖиүІеӣҫ
:return:
"""
shp = shaperead.Reader(shp_path)
cas = get_record(shp, 'SUBREGION', 'Central Asia')
gdp = [r.attributes['GDP_MD_EST'] for r in cas]
gdp_min = min(gdp)
gdp_max = max(gdp)
ax = plt.axes(projection=ccrs.PlateCarree())
ax.set_extent([45, 90, 35, 55])
for r in cas:
color = cm.Greens((r.attributes['GDP_MD_EST'] - gdp_min) / (gdp_max - gdp_min))
ax.add_geometries(r.geometry, ccrs.PlateCarree(),
facecolor=color, edgecolor='black', linewidth=0.5)
ax.text(r.geometry.centroid.x, r.geometry.centroid.y, r.attributes['ADMIN'],
horizontalalignment='center',
verticalalignment='center',
transform=ccrs.Geodetic())
ax.set_xticks([45, 55, 65, 75, 85], crs=ccrs.PlateCarree()) # xеқҗж Үж ҮжіЁ
ax.set_yticks([35, 45, 55], crs=ccrs.PlateCarree()) # y еқҗж Үж ҮжіЁ
lon_formatter = LongitudeFormatter(zero_direction_label=True)
lat_formatter = LatitudeFormatter()
ax.xaxis.set_major_formatter(lon_formatter)
ax.yaxis.set_major_formatter(lat_formatter)
plt.title('GDP TEST')
plt.savefig("gdb.png")
plt.show()
def run_excel():
if os.path.exists("SURF_CHN_MUL_HOR_STATION.xlsx"):
read_excel("SURF_CHN_MUL_HOR_STATION.xlsx")
else:
download_file(dataurl)
read_excel("SURF_CHN_MUL_HOR_STATION.xlsx")
def run_shp():
if os.path.exists("ne_10m_admin_0_countries"):
gdp("ne_10m_admin_0_countries/ne_10m_admin_0_countries.shp")
else:
download_file(shpurl)
unzip('ne_10m_admin_0_countries.zip', "ne_10m_admin_0_countries")
gdp("ne_10m_admin_0_countries/ne_10m_admin_0_countries.shp")
if __name__ == '__main__':
# download_file(dataurl)
# download_file(shpurl)
# cas = get_record('SUBREGION', 'Central Asia')
# print([r.attributes['ADMIN'] for r in cas])
# read_excel('SURF_CHN_MUL_HOR_STATION.xlsx')
# gdp()
run_excel()
run_shp()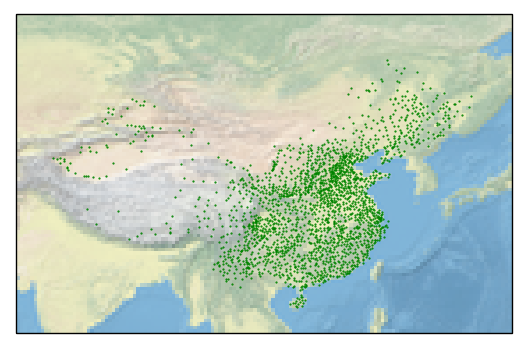
ж„ҹи°ўдҪ иғҪеӨҹи®Өзңҹйҳ…иҜ»е®ҢиҝҷзҜҮж–Үз« пјҢеёҢжңӣе°Ҹзј–еҲҶдә«зҡ„вҖңPythonдёӯexcelе’ҢshpеҰӮдҪ•дҪҝз”ЁеңЁmatplotlibвҖқиҝҷзҜҮж–Үз« еҜ№еӨ§е®¶жңүеё®еҠ©пјҢеҗҢж—¶д№ҹеёҢжңӣеӨ§е®¶еӨҡеӨҡж”ҜжҢҒдәҝйҖҹдә‘пјҢе…іжіЁдәҝйҖҹдә‘иЎҢдёҡиө„и®Ҝйў‘йҒ“пјҢжӣҙеӨҡзӣёе…ізҹҘиҜҶзӯүзқҖдҪ жқҘеӯҰд№ !
е…ҚиҙЈеЈ°жҳҺпјҡжң¬з«ҷеҸ‘еёғзҡ„еҶ…е®№пјҲеӣҫзүҮгҖҒи§Ҷйў‘е’Ңж–Үеӯ—пјүд»ҘеҺҹеҲӣгҖҒиҪ¬иҪҪе’ҢеҲҶдә«дёәдё»пјҢж–Үз« и§ӮзӮ№дёҚд»ЈиЎЁжң¬зҪ‘з«ҷз«ӢеңәпјҢеҰӮжһңж¶үеҸҠдҫөжқғиҜ·иҒ”зі»з«ҷй•ҝйӮ®з®ұпјҡis@yisu.comиҝӣиЎҢдёҫжҠҘпјҢ并жҸҗдҫӣзӣёе…іиҜҒжҚ®пјҢдёҖз»ҸжҹҘе®һпјҢе°Ҷз«ӢеҲ»еҲ йҷӨж¶үе«ҢдҫөжқғеҶ…е®№гҖӮ
жӮЁеҘҪпјҢзҷ»еҪ•еҗҺжүҚиғҪдёӢи®ўеҚ•е“ҰпјҒ