您好,登录后才能下订单哦!
密码登录
登录注册
点击 登录注册 即表示同意《亿速云用户服务条款》
这篇文章将为大家详细讲解有关如何使用Python绘制3D图形,文章内容质量较高,因此小编分享给大家做个参考,希望大家阅读完这篇文章后对相关知识有一定的了解。
1、云计算,典型应用OpenStack。2、WEB前端开发,众多大型网站均为Python开发。3.人工智能应用,基于大数据分析和深度学习而发展出来的人工智能本质上已经无法离开python。4、系统运维工程项目,自动化运维的标配就是python+Django/flask。5、金融理财分析,量化交易,金融分析。6、大数据分析。
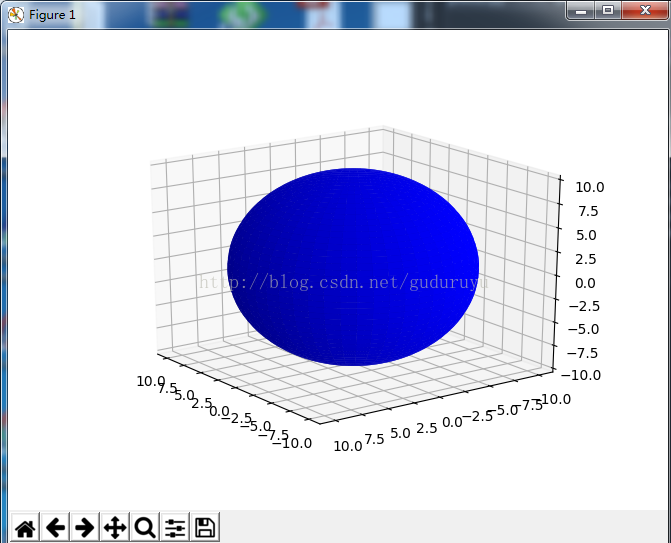
1、3D表面形状的绘制
from mpl_toolkits.mplot3d import Axes3D
import matplotlib.pyplot as plt
import numpy as np

fig = plt.figure()
ax = fig.add_subplot(111, projection='3d')

# Make data
u = np.linspace(0, 2 * np.pi, 100)
v = np.linspace(0, np.pi, 100)
x = 10 * np.outer(np.cos(u), np.sin(v))
y = 10 * np.outer(np.sin(u), np.sin(v))
z = 10 * np.outer(np.ones(np.size(u)), np.cos(v))

# Plot the surface
ax.plot_surface(x, y, z, color='b')

plt.show()
球表面,结果如下:
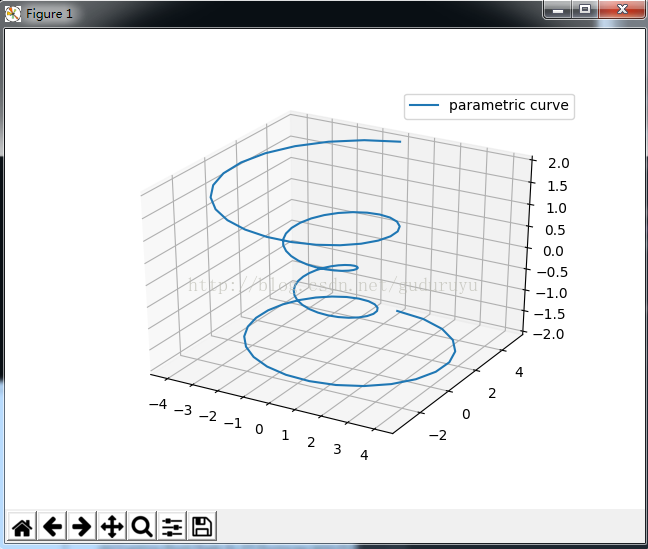
2、3D直线(曲线)的绘制
import matplotlib as mpl
from mpl_toolkits.mplot3d import Axes3D
import numpy as np
import matplotlib.pyplot as plt

mpl.rcParams['legend.fontsize'] = 10

fig = plt.figure()
ax = fig.gca(projection='3d')
theta = np.linspace(-4 * np.pi, 4 * np.pi, 100)
z = np.linspace(-2, 2, 100)
r = z**2 + 1
x = r * np.sin(theta)
y = r * np.cos(theta)
ax.plot(x, y, z, label='parametric curve')
ax.legend()

plt.show()
这段代码用于绘制一个螺旋状3D曲线,结果如下:
3、绘制3D轮廓
from mpl_toolkits.mplot3d import axes3d
import matplotlib.pyplot as plt
from matplotlib import cm

fig = plt.figure()
ax = fig.gca(projection='3d')
X, Y, Z = axes3d.get_test_data(0.05)
cset = ax.contour(X, Y, Z, zdir='z', offset=-100, cmap=cm.coolwarm)
cset = ax.contour(X, Y, Z, zdir='x', offset=-40, cmap=cm.coolwarm)
cset = ax.contour(X, Y, Z, zdir='y', offset=40, cmap=cm.coolwarm)

ax.set_xlabel('X')
ax.set_xlim(-40, 40)
ax.set_ylabel('Y')
ax.set_ylim(-40, 40)
ax.set_zlabel('Z')
ax.set_zlim(-100, 100)

plt.show()
绘制结果如下:

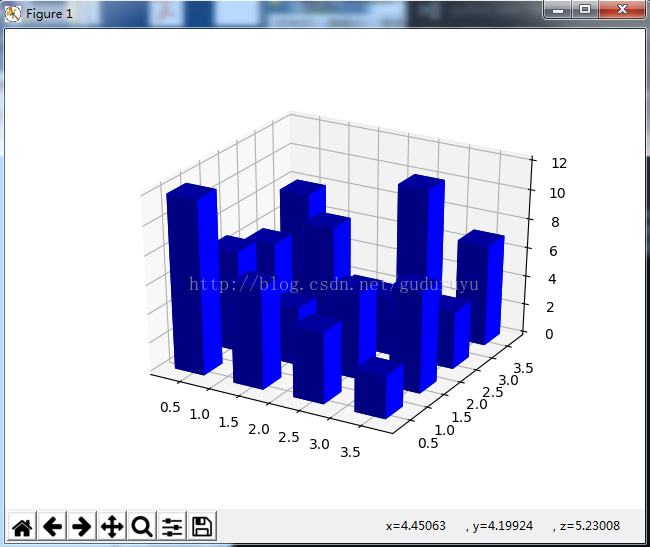
4、绘制3D直方图
from mpl_toolkits.mplot3d import Axes3D
import matplotlib.pyplot as plt
import numpy as np

fig = plt.figure()
ax = fig.add_subplot(111, projection='3d')
x, y = np.random.rand(2, 100) * 4
hist, xedges, yedges = np.histogram2d(x, y, bins=4, range=[[0, 4], [0, 4]])

# Construct arrays for the anchor positions of the 16 bars.
# Note: np.meshgrid gives arrays in (ny, nx) so we use 'F' to flatten xpos,
# ypos in column-major order. For numpy >= 1.7, we could instead call meshgrid
# with indexing='ij'.
xpos, ypos = np.meshgrid(xedges[:-1] + 0.25, yedges[:-1] + 0.25)
xpos = xpos.flatten('F')
ypos = ypos.flatten('F')
zpos = np.zeros_like(xpos)

# Construct arrays with the dimensions for the 16 bars.
dx = 0.5 * np.ones_like(zpos)
dy = dx.copy()
dz = hist.flatten()

ax.bar3d(xpos, ypos, zpos, dx, dy, dz, color='b', zsort='average')

plt.show()
绘制结果如下:
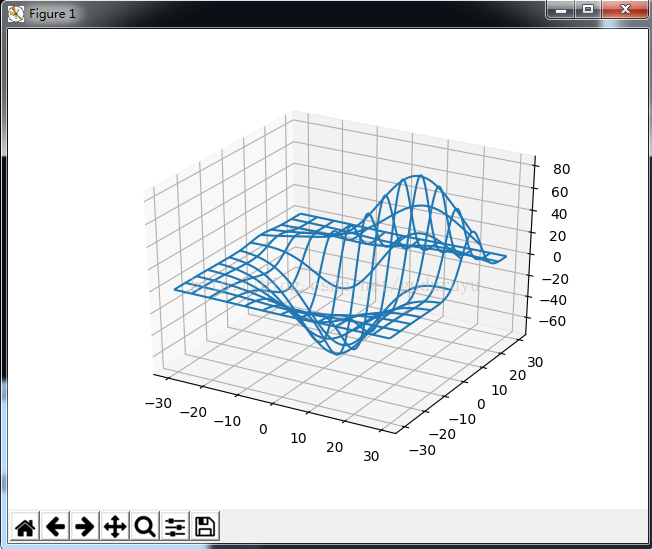
5、绘制3D网状线
from mpl_toolkits.mplot3d import axes3d
import matplotlib.pyplot as plt


fig = plt.figure()
ax = fig.add_subplot(111, projection='3d')

# Grab some test data.
X, Y, Z = axes3d.get_test_data(0.05)

# Plot a basic wireframe.
ax.plot_wireframe(X, Y, Z, rstride=10, cstride=10)

plt.show()
绘制结果如下:
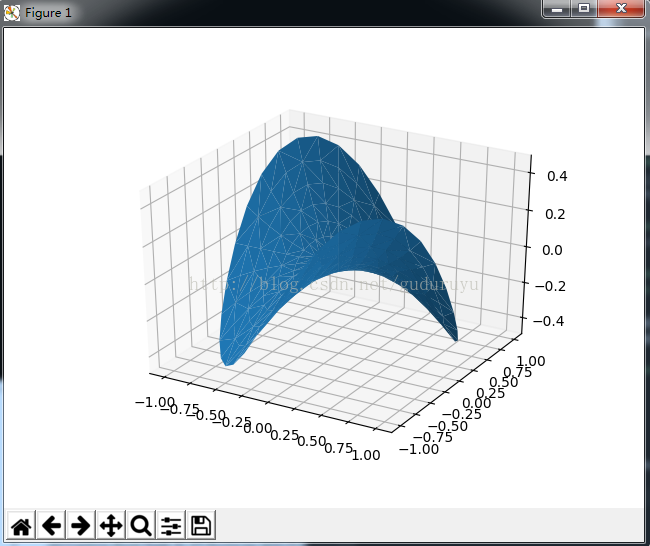
6、绘制3D三角面片图
from mpl_toolkits.mplot3d import Axes3D
import matplotlib.pyplot as plt
import numpy as np


n_radii = 8
n_angles = 36

# Make radii and angles spaces (radius r=0 omitted to eliminate duplication).
radii = np.linspace(0.125, 1.0, n_radii)
angles = np.linspace(0, 2*np.pi, n_angles, endpoint=False)

# Repeat all angles for each radius.
angles = np.repeat(angles[..., np.newaxis], n_radii, axis=1)

# Convert polar (radii, angles) coords to cartesian (x, y) coords.
# (0, 0) is manually added at this stage, so there will be no duplicate
# points in the (x, y) plane.
x = np.append(0, (radii*np.cos(angles)).flatten())
y = np.append(0, (radii*np.sin(angles)).flatten())

# Compute z to make the pringle surface.
z = np.sin(-x*y)

fig = plt.figure()
ax = fig.gca(projection='3d')

ax.plot_trisurf(x, y, z, linewidth=0.2, antialiased=True)

plt.show(
绘制结果如下:
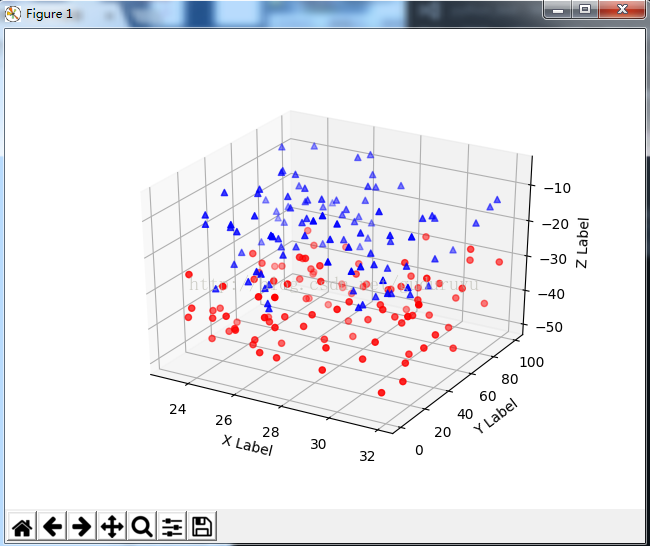
7、绘制3D散点图
from mpl_toolkits.mplot3d import Axes3D
import matplotlib.pyplot as plt
import numpy as np


def randrange(n, vmin, vmax):
 '''''
 Helper function to make an array of random numbers having shape (n, )
 with each number distributed Uniform(vmin, vmax).
 '''
 return (vmax - vmin)*np.random.rand(n) + vmin

fig = plt.figure()
ax = fig.add_subplot(111, projection='3d')

n = 100

# For each set of style and range settings, plot n random points in the box
# defined by x in [23, 32], y in [0, 100], z in [zlow, zhigh].
for c, m, zlow, zhigh in [('r', 'o', -50, -25), ('b', '^', -30, -5)]:
 xs = randrange(n, 23, 32)
 ys = randrange(n, 0, 100)
 zs = randrange(n, zlow, zhigh)
 ax.scatter(xs, ys, zs, c=c, marker=m)

ax.set_xlabel('X Label')
ax.set_ylabel('Y Label')
ax.set_zlabel('Z Label')

plt.show()
绘制结果如下:
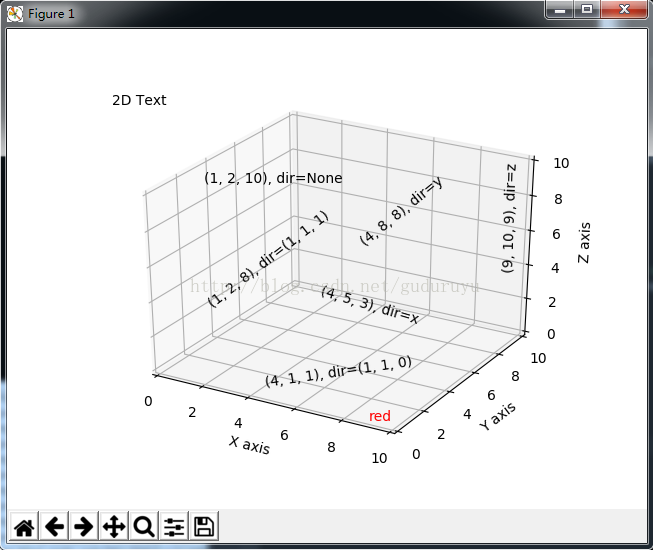
8、绘制3D文字
from mpl_toolkits.mplot3d import Axes3D
import matplotlib.pyplot as plt


fig = plt.figure()
ax = fig.gca(projection='3d')

# Demo 1: zdir
zdirs = (None, 'x', 'y', 'z', (1, 1, 0), (1, 1, 1))
xs = (1, 4, 4, 9, 4, 1)
ys = (2, 5, 8, 10, 1, 2)
zs = (10, 3, 8, 9, 1, 8)

for zdir, x, y, z in zip(zdirs, xs, ys, zs):
 label = '(%d, %d, %d), dir=%s' % (x, y, z, zdir)
 ax.text(x, y, z, label, zdir)

# Demo 2: color
ax.text(9, 0, 0, "red", color='red')

# Demo 3: text2D
# Placement 0, 0 would be the bottom left, 1, 1 would be the top right.
ax.text2D(0.05, 0.95, "2D Text", transform=ax.transAxes)

# Tweaking display region and labels
ax.set_xlim(0, 10)
ax.set_ylim(0, 10)
ax.set_zlim(0, 10)
ax.set_xlabel('X axis')
ax.set_ylabel('Y axis')
ax.set_zlabel('Z axis')

plt.show(
绘制结果如下:
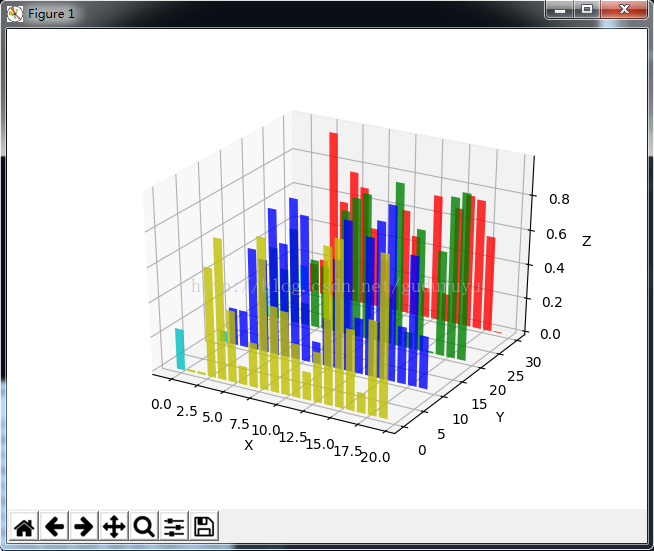
9、3D条状图
from mpl_toolkits.mplot3d import Axes3D
import matplotlib.pyplot as plt
import numpy as np

fig = plt.figure()
ax = fig.add_subplot(111, projection='3d')
for c, z in zip(['r', 'g', 'b', 'y'], [30, 20, 10, 0]):
 xs = np.arange(20)
 ys = np.random.rand(20)

 # You can provide either a single color or an array. To demonstrate this,
 # the first bar of each set will be colored cyan.
 cs = [c] * len(xs)
 cs[0] = 'c'
 ax.bar(xs, ys, zs=z, zdir='y', color=cs, alpha=0.8)

ax.set_xlabel('X')
ax.set_ylabel('Y')
ax.set_zlabel('Z')

plt.show()
绘制结果如下:
以上所述是小编给大家介绍的python绘制3D图形,希望对大家有所帮助,如果大家有任何疑问请给我留言,小编会及时回复大
关于如何使用Python绘制3D图形就分享到这里了,希望以上内容可以对大家有一定的帮助,可以学到更多知识。如果觉得文章不错,可以把它分享出去让更多的人看到。
免责声明:本站发布的内容(图片、视频和文字)以原创、转载和分享为主,文章观点不代表本网站立场,如果涉及侵权请联系站长邮箱:is@yisu.com进行举报,并提供相关证据,一经查实,将立刻删除涉嫌侵权内容。