您好,登录后才能下订单哦!
密码登录
登录注册
点击 登录注册 即表示同意《亿速云用户服务条款》
Android开发中怎么使用canvas绘制一个统计图?针对这个问题,这篇文章详细介绍了相对应的分析和解答,希望可以帮助更多想解决这个问题的小伙伴找到更简单易行的方法。
效果如下:
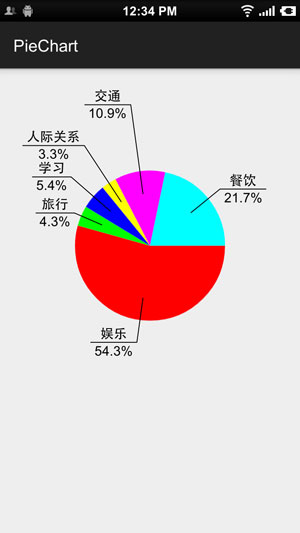
特点:
1.使用非常方便,可放在xml布局文件中,然后在代码中设置内容,即:
PieChartView pieChartView = (PieChartView) findViewById(R.id.pie_chart);
PieChartView.PieItemBean[] items = new PieChartView.PieItemBean[]{
    new PieChartView.PieItemBean("娱乐", 200),
    new PieChartView.PieItemBean("旅行", 100),
    new PieChartView.PieItemBean("学习", 120),
    new PieChartView.PieItemBean("人际关系", 160),
    new PieChartView.PieItemBean("交通", 100),
    new PieChartView.PieItemBean("餐饮", 480)
};
pieChartView.setPieItems(items);
2.条目数量,大小及折线位置,长度均自适应。左侧条目往左侧划线,右侧条目往右侧划线,文字描述与百分比居中对齐,并且文字“下划线”与文字长度自适应。对于很小的条目,将自动将折线延长以尽可能避免文字遮盖
核心代码:PieChartView.Java:
public class PieChartView extends View {
  private int screenW, screenH;
  /**
   * The paint to draw text, pie and line.
   */
  private Paint textPaint, piePaint, linePaint;
  /**
   * The center and the radius of the pie.
   */
  private int pieCenterX, pieCenterY, pieRadius;
  /**
   * The oval to draw the oval in.
   */
  private RectF pieOval;
  private float smallMargin;
  private int[] mPieColors = new int[]{Color.RED, Color.GREEN, Color.BLUE, Color.YELLOW, Color.MAGENTA, Color.CYAN};
  private PieItemBean[] mPieItems;
  private float totalValue;
  public PieChartView(Context context) {
    super(context);
    init(context);
  }
  public PieChartView(Context context, AttributeSet attrs) {
    super(context, attrs);
    init(context);
  }
  public PieChartView(Context context, AttributeSet attrs, int defStyleAttr) {
    super(context, attrs, defStyleAttr);
    init(context);
  }
  private void init(Context context) {
    //init screen
    screenW = ScreenUtils.getScreenW(context);
    screenH = ScreenUtils.getScreenH(context);
    pieCenterX = screenW / 2;
    pieCenterY = screenH / 3;
    pieRadius = screenW / 4;
    smallMargin = ScreenUtils.dp2px(context, 5);
    pieOval = new RectF();
    pieOval.left = pieCenterX - pieRadius;
    pieOval.top = pieCenterY - pieRadius;
    pieOval.right = pieCenterX + pieRadius;
    pieOval.bottom = pieCenterY + pieRadius;
    //The paint to draw text.
    textPaint = new Paint();
    textPaint.setAntiAlias(true);
    textPaint.setTextSize(ScreenUtils.dp2px(context, 16));
    //The paint to draw circle.
    piePaint = new Paint();
    piePaint.setAntiAlias(true);
    piePaint.setStyle(Paint.Style.FILL);
    //The paint to draw line to show the concrete text
    linePaint = new Paint();
    linePaint.setAntiAlias(true);
    linePaint.setStrokeWidth(ScreenUtils.dp2px(context, 1));
  }
  //The degree position of the last item arc's center.
  private float lastDegree = 0;
  //The count of the continues 'small' item.
  private int addTimes = 0;
  @Override
  protected void onDraw(Canvas canvas) {
    super.onDraw(canvas);
    if (mPieItems != null && mPieItems.length > 0) {
      float start = 0.0f;
      for (int i = 0; i < mPieItems.length; i++) {
        //draw pie
        piePaint.setColor(mPieColors[i % mPieColors.length]);
        float sweep = mPieItems[i].getItemValue() / totalValue * 360;
        canvas.drawArc(pieOval, start, sweep, true, piePaint);
        //draw line away from the pie
        float radians = (float) ((start + sweep / 2) / 180 * Math.PI);
        float lineStartX = pieCenterX + pieRadius * 0.7f * (float) (Math.cos(radians));
        float lineStartY = pieCenterY + pieRadius * 0.7f * (float) (Math.sin(radians));
        float lineStopX, lineStopY;
        float rate;
        if (getOffset(start + sweep / 2) > 60) {
          rate = 1.3f;
        } else if (getOffset(start + sweep / 2) > 30) {
          rate = 1.2f;
        } else {
          rate = 1.1f;
        }
        //If the item is very small, make the text further away from the pie to avoid being hided by other text.
        if (start + sweep / 2 - lastDegree < 30) {
          addTimes++;
          rate += 0.2f * addTimes;
        } else {
          addTimes = 0;
        }
        lineStopX = pieCenterX + pieRadius * rate * (float) (Math.cos(radians));
        lineStopY = pieCenterY + pieRadius * rate * (float) (Math.sin(radians));
        canvas.drawLine(lineStartX, lineStartY, lineStopX, lineStopY, linePaint);
        //write text
        String itemTypeText = mPieItems[i].getItemType();
        String itemPercentText = Utility.formatFloat(mPieItems[i].getItemValue() / totalValue * 100) + "%";
        float itemTypeTextLen = textPaint.measureText(itemTypeText);
        float itemPercentTextLen = textPaint.measureText(itemPercentText);
        float lineTextWidth = Math.max(itemTypeTextLen, itemPercentTextLen);
        float textStartX = lineStopX;
        float textStartY = lineStopY - smallMargin;
        float percentStartX = lineStopX;
        float percentStartY = lineStopY + textPaint.getTextSize();
        if (lineStartX > pieCenterX) {
          textStartX += (smallMargin + Math.abs(itemTypeTextLen - lineTextWidth) / 2);
          percentStartX += (smallMargin + Math.abs(itemPercentTextLen - lineTextWidth) / 2);
        } else {
          textStartX -= (smallMargin + lineTextWidth - Math.abs(itemTypeTextLen - lineTextWidth) / 2);
          percentStartX -= (smallMargin + lineTextWidth - Math.abs(itemPercentTextLen - lineTextWidth) / 2);
        }
        canvas.drawText(itemTypeText, textStartX, textStartY, textPaint);
        //draw percent text
        canvas.drawText(itemPercentText, percentStartX, percentStartY, textPaint);
        //draw text underline
        float textLineStopX = lineStopX;
        if (lineStartX > pieCenterX) {
          textLineStopX += (lineTextWidth + smallMargin * 2);
        } else {
          textLineStopX -= (lineTextWidth + smallMargin * 2);
        }
        canvas.drawLine(lineStopX, lineStopY, textLineStopX, lineStopY, linePaint);
        lastDegree = start + sweep / 2;
        start += sweep;
      }
    }
  }
  public PieItemBean[] getPieItems() {
    return mPieItems;
  }
  public void setPieItems(PieItemBean[] pieItems) {
    this.mPieItems = pieItems;
    totalValue = 0;
    for (PieItemBean item : mPieItems) {
      totalValue += item.getItemValue();
    }
    invalidate();
  }
  private float getOffset(float radius) {
    int a = (int) (radius % 360 / 90);
    switch (a) {
      case 0:
        return radius;
      case 1:
        return 180 - radius;
      case 2:
        return radius - 180;
      case 3:
        return 360 - radius;
    }
    return radius;
  }
  static class PieItemBean {
    private String itemType;
    private float itemValue;
    PieItemBean(String itemType, float itemValue) {
      this.itemType = itemType;
      this.itemValue = itemValue;
    }
    public String getItemType() {
      return itemType;
    }
    public void setItemType(String itemType) {
      this.itemType = itemType;
    }
    public float getItemValue() {
      return itemValue;
    }
    public void setItemValue(float itemValue) {
      this.itemValue = itemValue;
    }
  }
}
关于Android开发中怎么使用canvas绘制一个统计图问题的解答就分享到这里了,希望以上内容可以对大家有一定的帮助,如果你还有很多疑惑没有解开,可以关注亿速云行业资讯频道了解更多相关知识。
免责声明:本站发布的内容(图片、视频和文字)以原创、转载和分享为主,文章观点不代表本网站立场,如果涉及侵权请联系站长邮箱:is@yisu.com进行举报,并提供相关证据,一经查实,将立刻删除涉嫌侵权内容。