жӮЁеҘҪпјҢзҷ»еҪ•еҗҺжүҚиғҪдёӢи®ўеҚ•е“ҰпјҒ
еҜҶз Ғзҷ»еҪ•
зҷ»еҪ•жіЁеҶҢ
зӮ№еҮ» зҷ»еҪ•жіЁеҶҢ еҚіиЎЁзӨәеҗҢж„ҸгҖҠдәҝйҖҹдә‘з”ЁжҲ·жңҚеҠЎжқЎж¬ҫгҖӢ
е°Ҹзј–з»ҷеӨ§е®¶еҲҶдә«дёҖдёӢеҰӮдҪ•дҪҝз”ЁPerformance SchemaжҹҘзңӢProfilingпјҢеёҢжңӣеӨ§е®¶йҳ…иҜ»е®ҢиҝҷзҜҮж–Үз« д№ӢеҗҺйғҪжңүжүҖ收иҺ·пјҢдёӢйқўи®©жҲ‘们дёҖиө·еҺ»жҺўи®Ёеҗ§пјҒ
SHOW PROFILEеҸҜд»Ҙз”ЁжқҘMySQLжү§иЎҢиҜӯеҸҘж—¶еҖҷжүҖдҪҝз”Ёзҡ„иө„жәҗпјҲиҜёеҰӮIOпјҢдёҠдёӢж–ҮеҲҮжҚўпјҢCPUпјҢMemoryзӯүзӯүпјү,дҪҶжҳҜд»ҺMySQL 5.6.7ејҖе§ӢжӯӨзү№жҖ§е°Ҷ被移йҷӨпјҢиҖҢдҪҝз”ЁPerformance Schemaд»ЈжӣҝпјҢеҰӮдёӢпјҡ

MySQL 5.7.8, еҸҜд»ҘйҖҡиҝҮsetup_actorsиЎЁжқҘй…ҚзҪ®host, user, or accountзҡ„дҝЎжҒҜ被收йӣҶпјҢеҰӮдёӢпјҡ
#й»ҳи®Өжғ…еҶөдёӢsetup_actors зҡ„й…ҚзҪ®жҳҜе…Ғи®ёзӣ‘жҺ§е’Ң收йӣҶжүҖжңүеүҚеҸ°зәҝзЁӢзҡ„еҺҶеҸІдәӢ件дҝЎжҒҜ
>SELECT * FROM
performance_schema.setup_actors;
+------+------+------+---------+---------+
| HOST | USER | ROLE | ENABLED | HISTORY |
+------+------+------+---------+---------+
| % | % | %
| YES | YES |
+------+------+------+---------+---------+
1 row in set (0.03 sec)
#дҝ®ж”№й»ҳи®Өзҡ„й…ҚзҪ®пјҢе…ій—ӯеҜ№жүҖжңүеүҚеҸ°зәҝзЁӢзҡ„зӣ‘жҺ§е’Ң收йӣҶгҖӮ并且жҸ’е…Ҙж–°зҡ„иЎҢдёәжҢҮе®ҡзҡ„з”ЁжҲ·ејҖеҗҜзӣ‘жҺ§е’Ң收йӣҶдҝЎжҒҜ
mysql>
UPDATE performance_schema.setup_actors SET ENABLED = 'NO', HISTORY = 'NO'
-> WHERE HOST = '%' AND USER = '%';
mysql> INSERT INTO performance_schema.setup_actors
(HOST,USER,ROLE,ENABLED,HISTORY)
-> VALUES('localhost','test_user','%','YES','YES');
#дҝ®ж”№еҗҺзҡ„й…ҚзҪ®еҰӮдёӢпјҡ
mysql> SELECT * FROM performance_schema.setup_actors;
+-----------+-----------+------+---------+---------+
| HOST | USER | ROLE | ENABLED | HISTORY |
+-----------+-----------+------+---------+---------+
| % | % | % | NO | NO |
| localhost | test_user | % | YES | YES |
+-----------+-----------+------+---------+---------+
#еҸӘзӣ‘жҺ§е’Ң收йӣҶtest_user@localhostз”ЁжҲ·зӣёе…ізҡ„дәӢ件дҝЎжҒҜ
mysql> UPDATE performance_schema.setup_instruments SET ENABLED = 'YES', TIMED = 'YES' |
mysql> UPDATE performance_schema.setup_consumers SET ENABLED = 'YES' |
mysql >set profiling=1; Query OK, 0 rows affected, 1 warning (0.00 sec) mysql >show warnings; #жӯӨеӨ„пјҢд№ҹеҸҜд»ҘзңӢеҲ°жӯӨзү№жҖ§е°Ҷ被移йҷӨзҡ„иӯҰе‘Ҡ +---------+------+----------------------------------------------------------------------+ | Level | Code | Message | +---------+------+----------------------------------------------------------------------+ | Warning | 1287 | '@@profiling' is deprecated and will be removed in a future release. | +---------+------+----------------------------------------------------------------------+ 1 row in set (0.00 sec) |
mysql >select * from t; +----+------+ | 9 | 15 | | 10 | 15 | | 2 | 20 | | 3 | 20 | | 8 | 25 | +----+------+ 5 rows in set (0.00 sec)5 rows in set (0.00 sec) |
mysql>show profiles; |
mysql>show profile for query 2; |
жіЁпјҡжӯӨеӨ„еҸӘдёәдәҶиҜҙжҳҺй—®йўҳпјҢеҸҜиғҪиҝҳжҹҘиҜўеҲ°еҫҲеӨҡе…¶д»–зҡ„SQLпјҢдҪҶжҳҜжҲ‘们иҮӘе·ұзҹҘйҒ“жҲ‘们жү§иЎҢзҡ„SQLжҳҜе“ӘжқЎпјҢе…¶д»–зҡ„SQLжӯӨеӨ„йғҪиў«зңҒз•ҘдәҶ
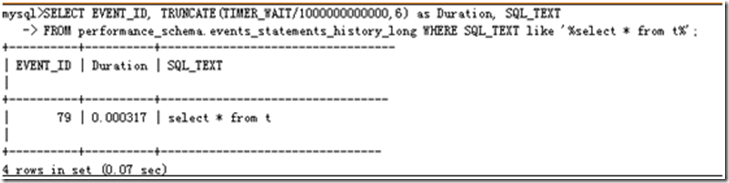
mysql>SELECT event_name AS Stage, TRUNCATE(TIMER_WAIT/1000000000000,6) AS Duration
>FROM performance_schema.events_stages_history_long WHERE NESTING_EVENT_ID=79; |
еҰӮдёҠпјҢе®һзҺ°дәҶйҖҡиҝҮPerformance SchemaжқҘжҹҘиҜўprofileingзӣёе…ідҝЎжҒҜпјҢжңҖз»ҲиғҪзңӢеҲ°зҡ„йҖүйЎ№и·ҹshow profileжҳҫзӨәзҡ„йҖүйЎ№еҮ д№ҺдёҖж ·пјҢеҸӘжҳҜеҗ„йЎ№зҡ„еҖјеҘҪеғҸдёҚеӨӘдёҖиҮҙгҖӮ
зңӢе®ҢдәҶиҝҷзҜҮж–Үз« пјҢзӣёдҝЎдҪ еҜ№вҖңеҰӮдҪ•дҪҝз”ЁPerformance SchemaжҹҘзңӢProfilingвҖқжңүдәҶдёҖе®ҡзҡ„дәҶи§ЈпјҢеҰӮжһңжғідәҶи§ЈжӣҙеӨҡзӣёе…ізҹҘиҜҶпјҢж¬ўиҝҺе…іжіЁдәҝйҖҹдә‘иЎҢдёҡиө„и®Ҝйў‘йҒ“пјҢж„ҹи°ўеҗ„дҪҚзҡ„йҳ…иҜ»пјҒ
е…ҚиҙЈеЈ°жҳҺпјҡжң¬з«ҷеҸ‘еёғзҡ„еҶ…е®№пјҲеӣҫзүҮгҖҒи§Ҷйў‘е’Ңж–Үеӯ—пјүд»ҘеҺҹеҲӣгҖҒиҪ¬иҪҪе’ҢеҲҶдә«дёәдё»пјҢж–Үз« и§ӮзӮ№дёҚд»ЈиЎЁжң¬зҪ‘з«ҷз«ӢеңәпјҢеҰӮжһңж¶үеҸҠдҫөжқғиҜ·иҒ”зі»з«ҷй•ҝйӮ®з®ұпјҡis@yisu.comиҝӣиЎҢдёҫжҠҘпјҢ并жҸҗдҫӣзӣёе…іиҜҒжҚ®пјҢдёҖз»ҸжҹҘе®һпјҢе°Ҷз«ӢеҲ»еҲ йҷӨж¶үе«ҢдҫөжқғеҶ…е®№гҖӮ
жӮЁеҘҪпјҢзҷ»еҪ•еҗҺжүҚиғҪдёӢи®ўеҚ•е“ҰпјҒ