您好,登录后才能下订单哦!
密码登录
登录注册
点击 登录注册 即表示同意《亿速云用户服务条款》
这篇文章给大家介绍Matplotlib库基础中如何自动调整函数,内容非常详细,感兴趣的小伙伴们可以参考借鉴,希望对大家能有所帮助。
在matplotlib中,轴Axes的位置以标准化图形坐标指定,可能发生的情况是轴标签、标题、刻度标签等等会超出图形区域,导致显示不全。Matplotlib v1.1 引入了一个新的命令tight_layout(),作用是自动调整子图参数,使之填充整个图像区域。
调用plt.show()函数时会自动运行tight_layout()函数,如下所示:
def show(self):
self.figure.tight_layout()
FigureCanvasAgg.draw(self)
if PORT is None:
return
if matplotlib.__version__ < '1.2':
buffer = self.tostring_rgb(0, 0)
else:
buffer = self.tostring_rgb()
if len(set(buffer)) <= 1:
# do not plot empty
return
render = self.get_renderer()
width = int(render.width)
plot_index = index if os.getenv("PYCHARM_MATPLOTLIB_INTERACTIVE", False) else -1
try:
sock = socket.socket()
sock.connect((HOST, PORT))
sock.send(struct.pack('>i', width))
sock.send(struct.pack('>i', plot_index))
sock.send(struct.pack('>i', len(buffer)))
sock.send(buffer)
except OSError as _:
# nothing bad. It just means, that our tool window doesn't run yet
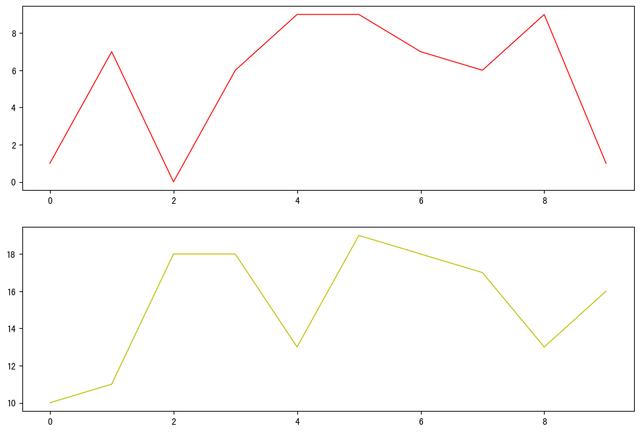
pass我们通过以下一个例程来介绍,最终的显示效果如下所示:
fig = plt.figure(figsize=(12, 8))
ax1 = fig.add_subplot(211)
ax2 = fig.add_subplot(212)
ax1.plot(np.arange(10), np.random.randint(0, 10, 10), ls='-', c='r', lw=1)
ax2.plot(np.arange(10), np.random.randint(10, 20, 10), ls='-', c='y', lw=1)
plt.show()
不过很多时候会出现tight_layout()不工作的情况,比如出现以下提示:
UserWarning: This figure includes Axes that are not compatible with tight_layout, so results might be incorrect. warnings.warn("This figure includes Axes that are not compatible "
这个警告的原因是tight_layout这个函数出错了,警告语句出现的原因时axes列表为空,tight_layout()中相应的代码,如下所示:
subplotspec_list = get_subplotspec_list(self.axes)
if None in subplotspec_list:
cbook._warn_external("This figure includes Axes that are not "
"compatible with tight_layout, so results "
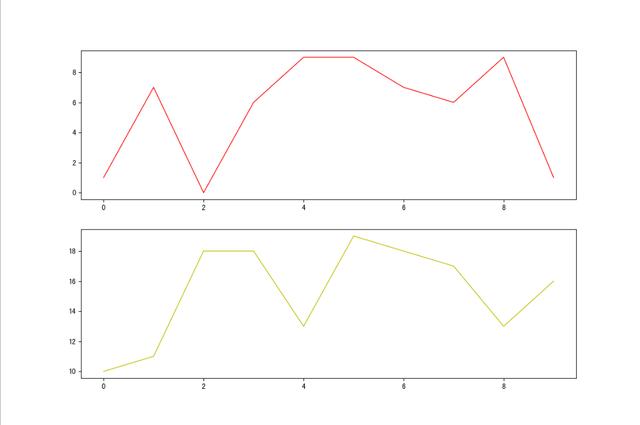
"might be incorrect.")可见这个函数并不太稳定。tight_layout不起作用的时候,绘图效果如下所示,可见子图并没有填充整个图像区域。
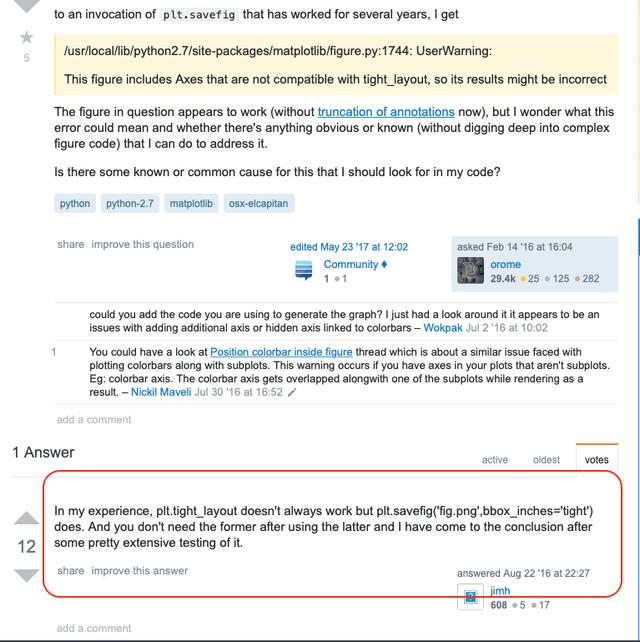
网上搜索了下发现也有类似的情况出现,附上部分案例的截图:
接下来我们尝试下解决方法,tight_layout在plt.savefig的调用方式相对比较稳定,我们将plt.show()函数替换为plt.savefig函数,替换后会在本地另外为png图片,该图片中子图填充了整个图像区域。
plt.savefig('fig.png', bbox_inches='tight') # 替换 plt.show()关于Matplotlib库基础中如何自动调整函数就分享到这里了,希望以上内容可以对大家有一定的帮助,可以学到更多知识。如果觉得文章不错,可以把它分享出去让更多的人看到。
免责声明:本站发布的内容(图片、视频和文字)以原创、转载和分享为主,文章观点不代表本网站立场,如果涉及侵权请联系站长邮箱:is@yisu.com进行举报,并提供相关证据,一经查实,将立刻删除涉嫌侵权内容。