您好,登录后才能下订单哦!
如何使用Chrome开发者工具研究JavaScript的垃圾回收机制,相信很多没有经验的人对此束手无策,为此本文总结了问题出现的原因和解决方法,通过这篇文章希望你能解决这个问题。
I use the following simple JavaScript code to illustrate:
var JerryTestArray = [];(function(){
      for( var i = 0; i < 100; i++){
        JerryTestArray[i] = document.createElement("div");
       }})();
Create a new empty tab in your Chrome, and first create a snapshot with empty heap status by click “Take Snapshot” button:
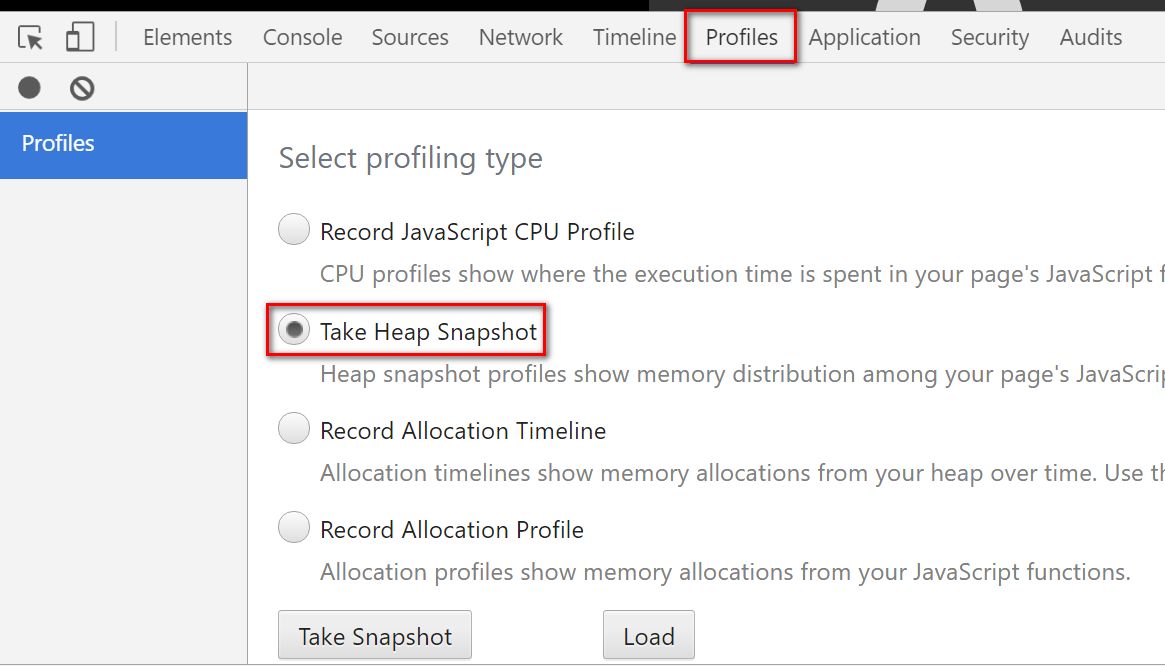
The Snapshot1 is generated.

Now switch to tab Console, paste the JavaScript code and execute it in console.
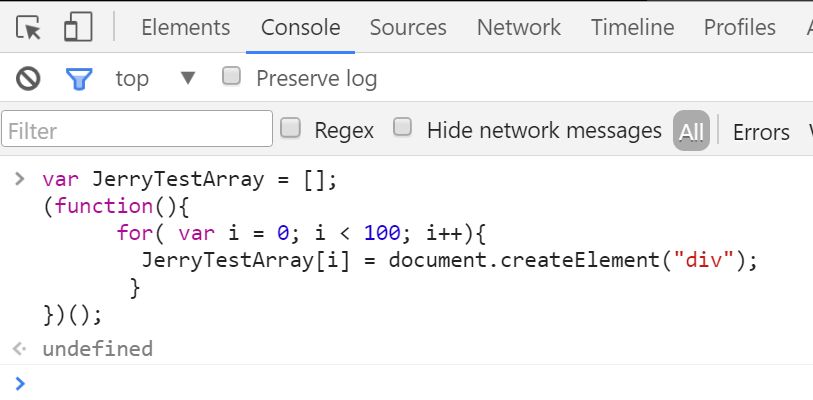
And switch to Profiles tab again to make the second snapshot:

Once done, select the second snapshot, choose “Comparison” and “Snapshot1” as filter:

We can find out from column “New” that 100 div nodes are created as we expect.

Since these nodes are not appended to document node so they are invisible to end user, so displayed as “Detached DOM”. The JerryTestArray still holds the reference to each div node so Garbage collector will not touch these nodes.
In order to make Garbage collector recycle the memory occupied by these nodes, just assign another value to JerryTestArray in console:
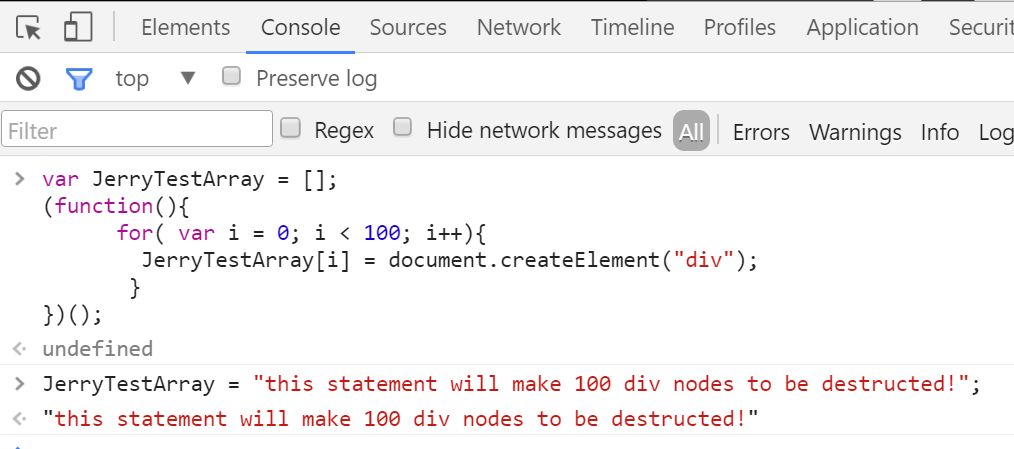
Once done, make the third snapshot and compare it with the second. Now we can find that the re-assignment to JerryTestArray will trigger the destruction of those 100 div nodes by Garbage collector:

Meanwhile, the string we use in assignment could also be inspected via the combination of filters below:
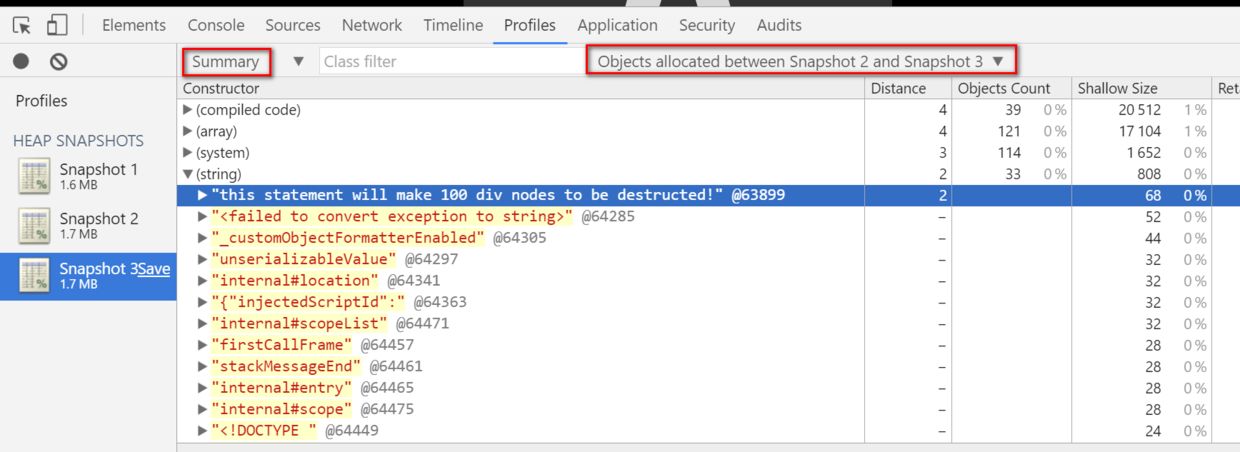
There is another kind of profile in Chrome development tool which can give you an overview about timeline of memory allocation:
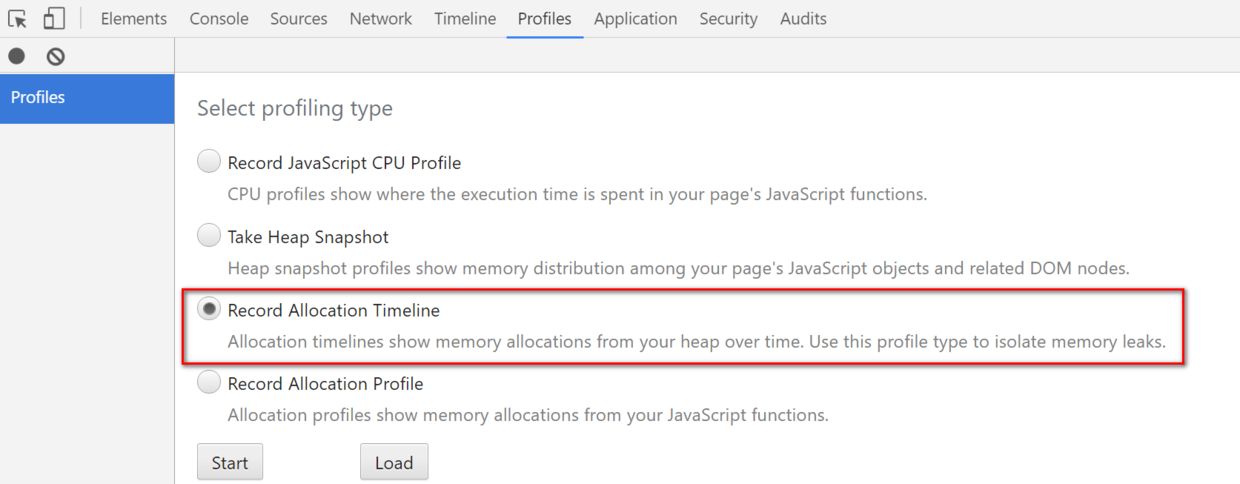
Click Start button in above screenshot, and paste the following code in console and executed:
var JerryTestArray = [];(function(){
      for( var i = 0; i < 98; i++){
        JerryTestArray[i] = document.createElement("span");
        JerryTestArray[i].className = "JerryClassName" + i;
       }})();
After the code is executed, paste the following code and execute:
JerryTestArray[30] = "this is a long test............................end";
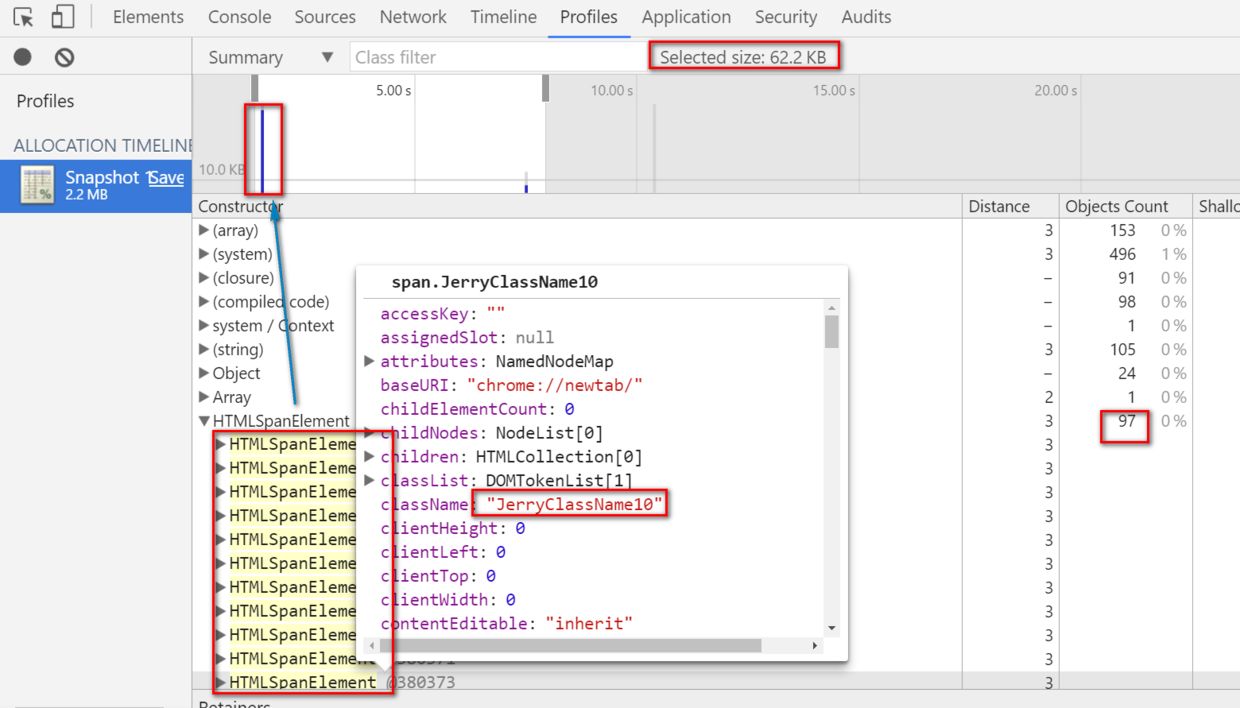
Now stop the profile. The profile is displayed as below. The highlighted vertical blue line indicates the timeslot when the 97 Span elements are created. Note that the number of Span elements displayed here is not 98 but 97 since Chrome development tool displays the final status of objects after “stop profile” button is clicked ( the reference to 30th Span element is replaced by String, so it is recycled by GC ).
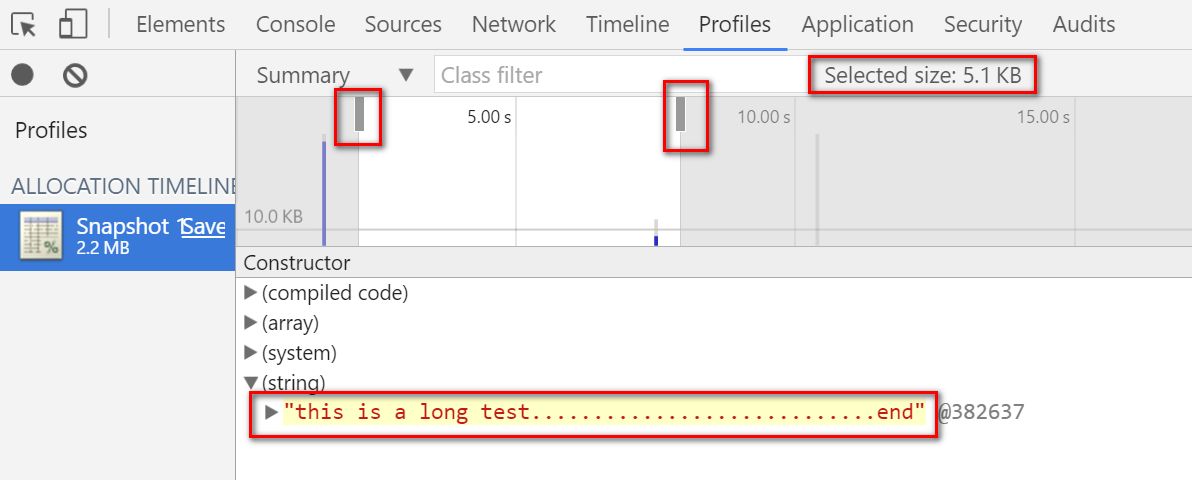
You can drag the two vertical bars to define the time range between which you would like to inspect. For example the time range below contains the timeslot when the below assignment occurs:
JerryTestArray[30] = "this is a long test............................end";
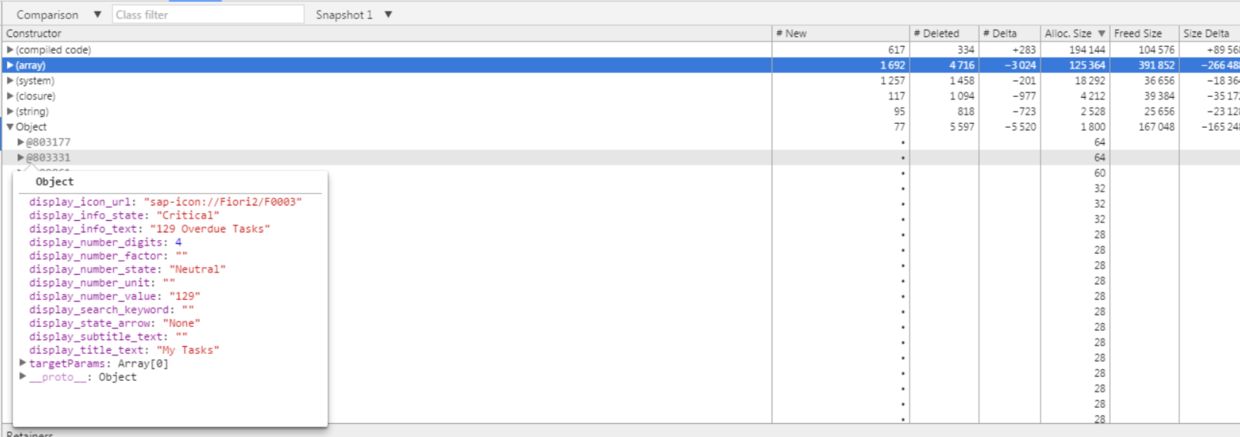
With this gained knowledge now we can check the memory allocation and destruction in some real application. For example click tile “My Tasks” to enter this application, make the first snapshot and click back button within application to return to launchpad, and make the second snapshot and review the comparison result.

From the result we find out lots of stuff are deleted after we return to launchpad:

Hover your mouse to a given destructed object and you can review its detail:
For more tips How I use Chrome development tool in my daily work, please refer to this blog Chrome Development Tool tips used in my daily work
看完上述内容,你们掌握如何使用Chrome开发者工具研究JavaScript的垃圾回收机制的方法了吗?如果还想学到更多技能或想了解更多相关内容,欢迎关注亿速云行业资讯频道,感谢各位的阅读!
免责声明:本站发布的内容(图片、视频和文字)以原创、转载和分享为主,文章观点不代表本网站立场,如果涉及侵权请联系站长邮箱:is@yisu.com进行举报,并提供相关证据,一经查实,将立刻删除涉嫌侵权内容。