您好,登录后才能下订单哦!
密码登录
登录注册
点击 登录注册 即表示同意《亿速云用户服务条款》
今天就跟大家聊聊有关使用R语言怎么绘制一个饼状图,可能很多人都不太了解,为了让大家更加了解,小编给大家总结了以下内容,希望大家根据这篇文章可以有所收获。
R语言是用于统计分析、绘图的语言和操作环境,属于GNU系统的一个自由、免费、源代码开放的软件,它是一个用于统计计算和统计制图的优秀工具。
在R语言中,饼图是使用pie()函数创建的,它使用正数作为向量输入。
使用R语言创建饼图的基本语法是
pie(x, labels, radius, main, col, clockwise)
以下是所使用的参数的描述
x是包含饼图中使用的数值的向量。
labels用于给出切片的描述。
radius表示饼图圆的半径(值-1和+1之间)。
main表示图表的标题。
col表示调色板。
clockwise是指示片段是顺时针还是逆时针绘制的逻辑值。
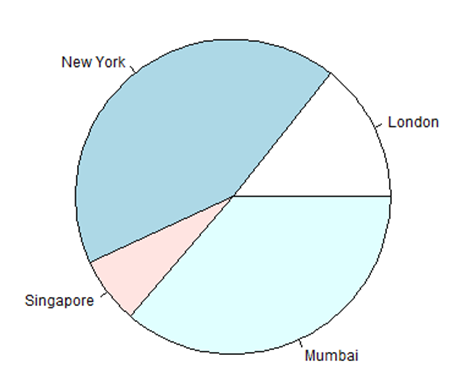
使用输入向量和标签创建一个非常简单的饼图。 以下脚本将创建并保存当前R语言工作目录中的饼图。
# Create data for the graph.
x <- c(21, 62, 10, 53)
labels <- c("London", "New York", "Singapore", "Mumbai")

# Give the chart file a name.
png(file = "city.jpg")

# Plot the chart.
pie(x,labels)

# Save the file.
dev.off()
当我们执行上面的代码,它产生以下结果 -
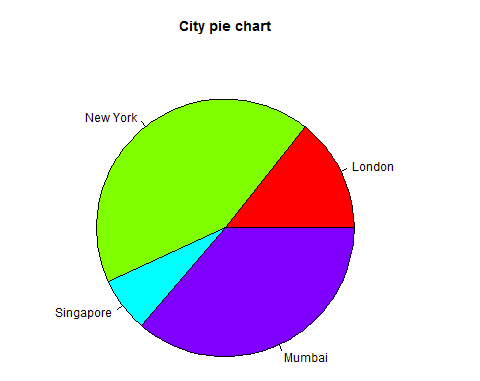
我们可以通过向函数中添加更多参数来扩展图表的功能。 我们将使用参数main向图表添加标题,另一个参数是col,它将在绘制图表时使用彩虹色板。 托盘的长度应与图表中的值的数量相同。 因此,我们使用length(x)。
以下脚本将创建并保存当前R语言工作目录中的饼图。
# Create data for the graph.
x <- c(21, 62, 10, 53)
labels <- c("London", "New York", "Singapore", "Mumbai")

# Give the chart file a name.
png(file = "city_title_colours.jpg")

# Plot the chart with title and rainbow color pallet.
pie(x, labels, main = "City pie chart", col = rainbow(length(x)))

# Save the file.
dev.off()
当我们执行上面的代码,它产生以下结果 -
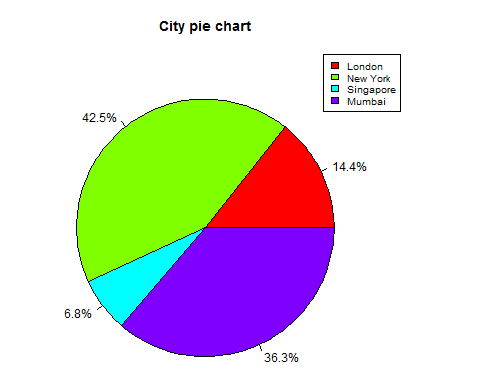
我们可以通过创建其他图表变量来添加切片百分比和图表图例。
# Create data for the graph.
x <-  c(21, 62, 10,53)
labels <-  c("London","New York","Singapore","Mumbai")

piepercent<- round(100*x/sum(x), 1)

# Give the chart file a name.
png(file = "city_percentage_legends.jpg")

# Plot the chart.
pie(x, labels = piepercent, main = "City pie chart",col = rainbow(length(x)))
legend("topright", c("London","New York","Singapore","Mumbai"), cex = 0.8,
   fill = rainbow(length(x)))

# Save the file.
dev.off()
当我们执行上面的代码,它产生以下结果 -
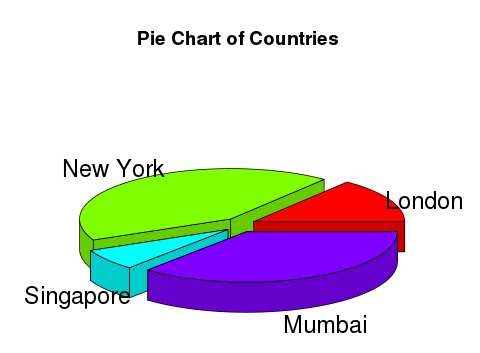
可以使用其他软件包绘制具有3个维度的饼图。 软件包plotrix有一个名为pie3D()的函数,用于此。
# Get the library.
library(plotrix)

# Create data for the graph.
x <-  c(21, 62, 10,53)
lbl <-  c("London","New York","Singapore","Mumbai")

# Give the chart file a name.
png(file = "3d_pie_chart.jpg")

# Plot the chart.
pie3D(x,labels = lbl,explode = 0.1, main = "Pie Chart of Countries ")

# Save the file.
dev.off()
当我们执行上面的代码,它产生以下结果 -
看完上述内容,你们对使用R语言怎么绘制一个饼状图有进一步的了解吗?如果还想了解更多知识或者相关内容,请关注亿速云行业资讯频道,感谢大家的支持。
免责声明:本站发布的内容(图片、视频和文字)以原创、转载和分享为主,文章观点不代表本网站立场,如果涉及侵权请联系站长邮箱:is@yisu.com进行举报,并提供相关证据,一经查实,将立刻删除涉嫌侵权内容。