您好,登录后才能下订单哦!
密码登录
登录注册
点击 登录注册 即表示同意《亿速云用户服务条款》
这篇文章将为大家详细讲解有关如何在matlab中设置xlabel,文章内容质量较高,因此小编分享给大家做个参考,希望大家阅读完这篇文章后对相关知识有一定的了解。
xlabel(‘time',‘FontSize',12);
如果没有设置位置,默认是在中间
xlabel(‘time',‘position',[900,1870],‘FontSize',12);
此时‘time'在你设置的位置
pos=axis;%取得当前坐标轴的范围,即[xmin xmax ymin ymax]
xlabel(‘time',‘FontSize',12, ‘Position',[pos(2) pos(3)])

x=0:pi/50:2*pi;
y=sin(x);
plot(x,y);
pos=axis;%取得当前坐标轴的范围,即[xmin xmax ymin ymax]
xlabel('x轴','position',[pos(2) 1.15*pos(3)]);%设置x轴标签的文本在图的右下方,1.15这个值根据自己的需要可以调整
形成的图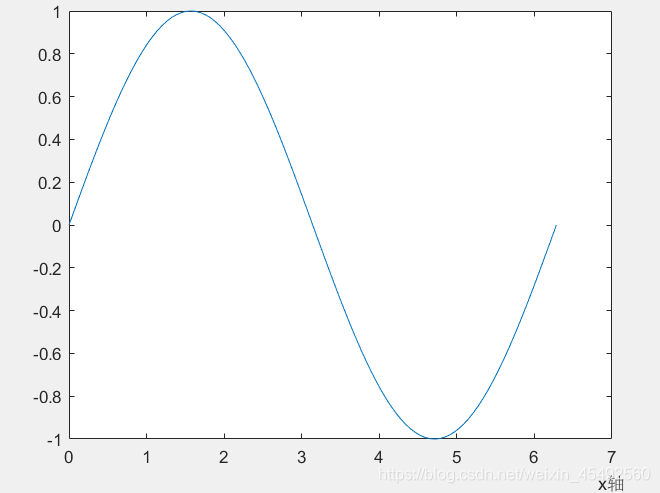
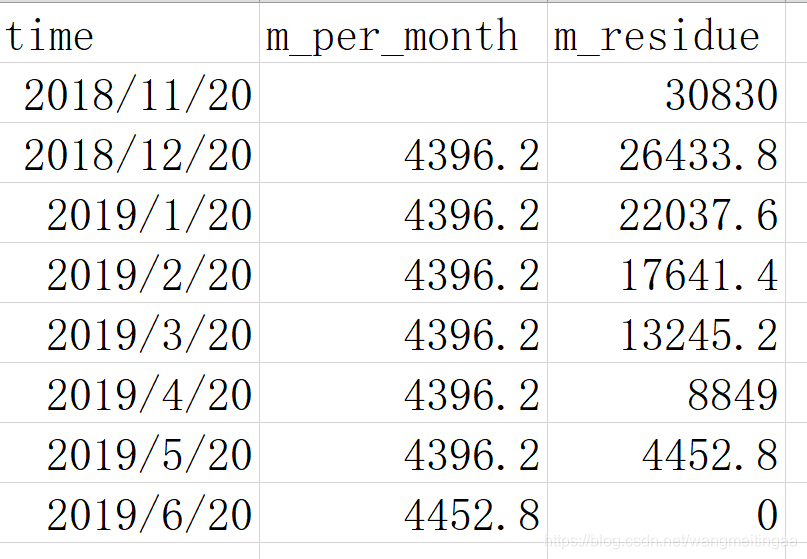
补充:Matlab作图实例——xlabel,ylabel,title,text,plot,patch,datetime等的应用
所用数据如下:
代码如下:
clear
clc
format compact
format shortG
T = readtable('repayment_schedule.xlsx','ReadVariableNames',true)
T.time=datetime(datestr(T.time,'yyyy.mm.dd'),'InputFormat','yyyy.MM.dd',...
'format','yyyy.MM.dd')
p=plot(T.time,T.m_per_month,T.time,T.m_residue)
p(1).Marker='o'
p(2).Marker='*'
box off
%让y轴不用科学计数法显示
h=gca
y_val=h.YTick
y_str=string(y_val) %等价于y_str=num2str(y_val')
h.YTickLabel=y_str
%横轴日期显示设置
h.XTick=T.time
xtickangle(45) %让x轴的标签逆时针旋转45度
%画垂直虚线
hold on
p1=plot([datetime(2018,11,20) datetime(2018,11,20)],...
[0 30830],'Color',[0.6 0.6 0.6],'LineStyle','--')
p2=plot([datetime(2018,12,20) datetime(2018,12,20)],...
[0 26434],'Color',[0.6 0.6 0.6],'LineStyle','--')
p3=plot([datetime(2019,01,20) datetime(2019,01,20)],...
[0 22038],'Color',[0.6 0.6 0.6],'LineStyle','--')
p4=plot([datetime(2019,02,20) datetime(2019,02,20)],...
[0 17641],'Color',[0.6 0.6 0.6],'LineStyle','--')
p5=plot([datetime(2019,03,20) datetime(2019,03,20)],...
[0 13245],'Color',[0.6 0.6 0.6],'LineStyle','--')
p6=plot([datetime(2019,04,20) datetime(2019,04,20)],...
[0 8849],'Color',[0.6 0.6 0.6],'LineStyle','--')
p7=plot([datetime(2019,05,20) datetime(2019,05,20)],...
[0 4452.8],'Color',[0.6 0.6 0.6],'LineStyle','--')
hold off
%标注每个点
str1=string(T.m_per_month)
str2=string(T.m_residue)
text(T.time,T.m_per_month-1200,str1,'Color',[0 0.447 0.741],...
'HorizontalAlignment','center')
text(datetime(datenum(T.time)+2,'ConvertFrom','datenum'),...
T.m_residue+1100,str2,...
'Color',[0.85 0.325 0.098],...
'HorizontalAlignment','left')
%图例
legend([p(1) p(2)],{'每月还款金额','每月还款后剩余总本息'},...
'Location','northeast','NumColumns',1)
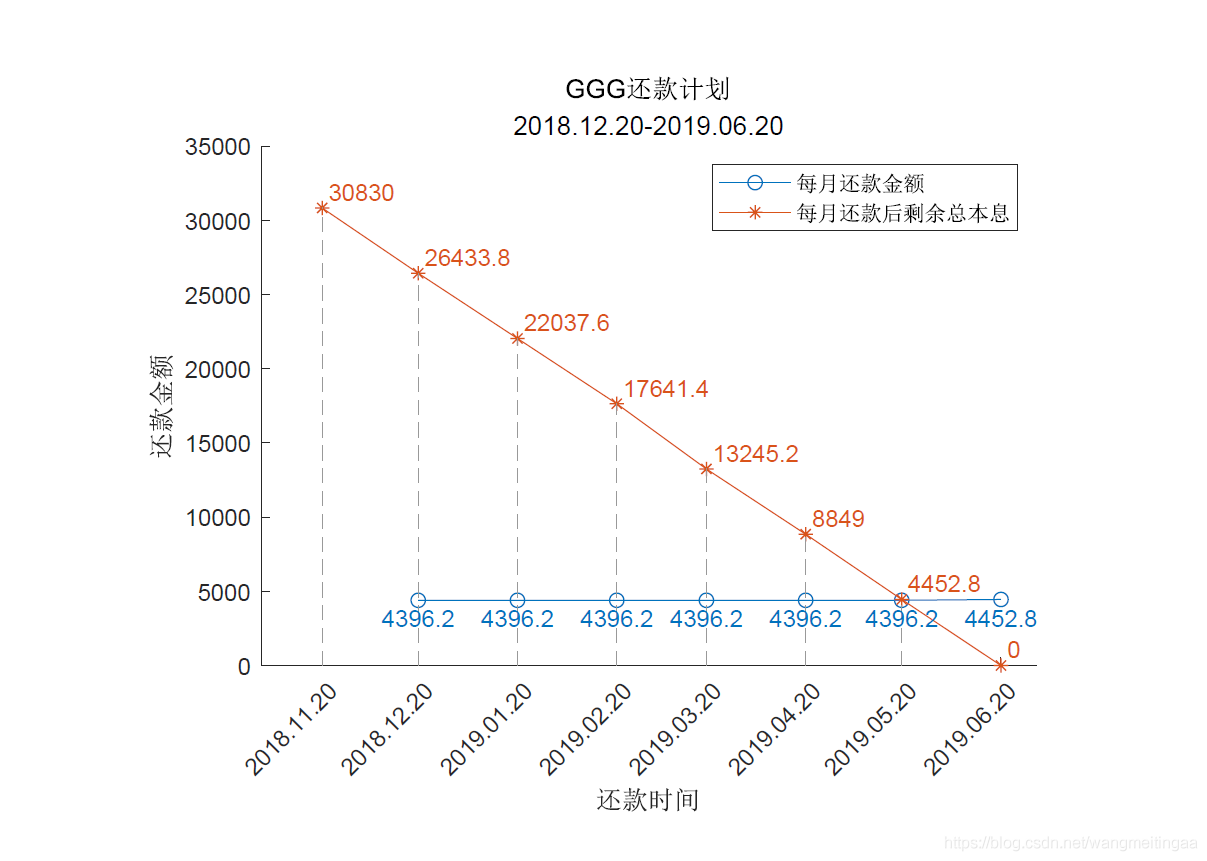
%各个标题
xlabel('还款时间')
ylabel('还款金额')
title({'GGG还款计划';'2018.12.20-2019.06.20'})
print('GGG还款计划','-dpdf')
%将数据再写入excel
% writetable(T,'test.xlsx','WriteVariableNames',true)做出的图如下:
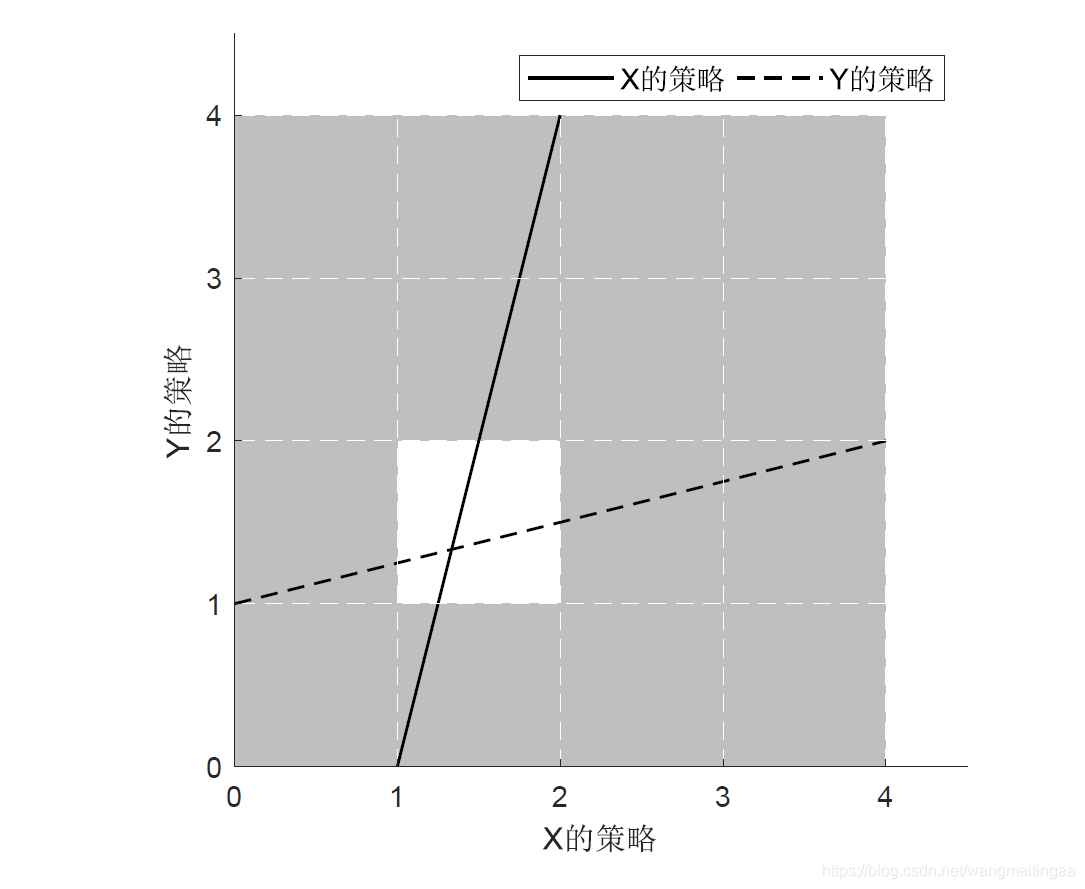
相应代码为:
%填充并画网格
clear
clc
v1 = [0 0; 4 0; 4 4;0 4];
f1 = [1 2 3 4];
figure
patch('Faces',f1,'Vertices',v1,...
    'EdgeColor',[0.75 0.75 0.75],'FaceColor',[0.75 0.75 0.75]);
g=gca
g.XTick=[0:4]
g.YTick=[0:4]
g.XLim=[0 4.5]
g.YLim=[0 4.5]
grid on
g.Layer = 'top';
g.GridColor=[1 1 1]
g.GridLineStyle='--'
g.GridAlpha = 1
axis square
%挖洞
v2 = [1 1;2 1;2 2;1 2];
f2 = [1 2 3 4];
patch('Faces',f2,'Vertices',v2,...
    'EdgeColor',[0.75 0.75 0.75],'FaceColor',[1 1 1]);
%画函数图
hold on
f1=@(t) 4*t-4
f2=@(t) 0.25*t+1
f1p=fplot(f1,[1 2],'k','LineWidth',1,'DisplayName','X的策略')
f2p=fplot(f2,[0 4],'--k','LineWidth',1,'DisplayName','Y的策略')
xlabel('X的策略')
ylabel('Y的策略')
legend([f1p f2p],{},'NumColumns',2,'FontSize',10)
%导出为PDF
% saveas(gcf,'qiyan.pdf')
print('qiyan','-dpdf')
做出的图如下
关于如何在matlab中设置xlabel就分享到这里了,希望以上内容可以对大家有一定的帮助,可以学到更多知识。如果觉得文章不错,可以把它分享出去让更多的人看到。
免责声明:本站发布的内容(图片、视频和文字)以原创、转载和分享为主,文章观点不代表本网站立场,如果涉及侵权请联系站长邮箱:is@yisu.com进行举报,并提供相关证据,一经查实,将立刻删除涉嫌侵权内容。