жӮЁеҘҪпјҢзҷ»еҪ•еҗҺжүҚиғҪдёӢи®ўеҚ•е“ҰпјҒ
еҜҶз Ғзҷ»еҪ•
зҷ»еҪ•жіЁеҶҢ
зӮ№еҮ» зҷ»еҪ•жіЁеҶҢ еҚіиЎЁзӨәеҗҢж„ҸгҖҠдәҝйҖҹдә‘з”ЁжҲ·жңҚеҠЎжқЎж¬ҫгҖӢ
иҝҷзҜҮж–Үз« дё»иҰҒд»Ӣз»ҚShellдёӯSamplerжңүд»Җд№Ҳз”ЁпјҢж–Үдёӯд»Ӣз»Қзҡ„йқһеёёиҜҰз»ҶпјҢе…·жңүдёҖе®ҡзҡ„еҸӮиҖғд»·еҖјпјҢж„ҹе…ҙи¶Јзҡ„е°Ҹдјҷдјҙ们дёҖе®ҡиҰҒзңӢе®ҢпјҒ
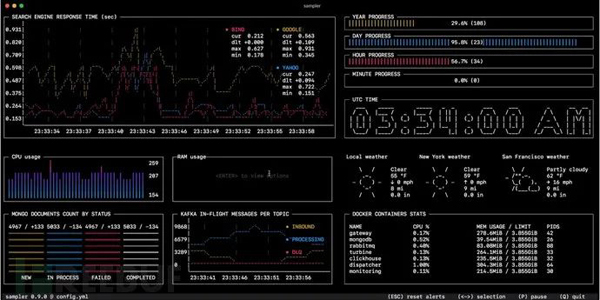
SamplerжҳҜдёҖдёӘз”ЁдәҺshellе‘Ҫд»Өжү§иЎҢпјҢеҸҜи§ҶеҢ–е’Ңе‘ҠиӯҰзҡ„е·Ҙе…·гҖӮе…¶й…ҚзҪ®дҪҝз”Ёзҡ„жҳҜдёҖдёӘз®ҖеҚ•зҡ„YAMLж–Ү件гҖӮ
дёәд»Җд№ҲжҲ‘йңҖиҰҒе®ғпјҹ
дҪ еҸҜд»ҘзӣҙжҺҘд»Һз»Ҳз«ҜеҜ№д»»ж„ҸеҠЁжҖҒиҝӣзЁӢиҝӣиЎҢйҮҮж · – и§ӮеҜҹж•°жҚ®еә“дёӯзҡ„жӣҙж”№пјҢзӣ‘жҺ§MQеҠЁжҖҒж¶ҲжҒҜпјҲin-flight messagesпјүпјҢи§ҰеҸ‘йғЁзҪІи„ҡжң¬е№¶еңЁе®ҢжҲҗеҗҺиҺ·еҸ–йҖҡзҹҘгҖӮ
еҰӮжһңжңүдёҖз§Қж–№жі•еҸҜд»ҘдҪҝз”Ёshellе‘Ҫд»ӨиҺ·еҸ–жҢҮж ҮпјҲmetricпјүпјҢйӮЈд№ҲеҸҜд»ҘдҪҝз”ЁSamplerз«ӢеҚіеҜ№е…¶иҝӣиЎҢеҸҜи§ҶеҢ–гҖӮ
е®үиЈ…
macOS
brew cask install sampler
жҲ–
sudo curl -Lo /usr/local/bin/sampler https://github.com/sqshq/sampler/releases/download/v1.0.3/sampler-1.0.3-darwin-amd64 sudo chmod +x /usr/local/bin/sampler
Linux
sudo wget https://github.com/sqshq/sampler/releases/download/v1.0.3/sampler-1.0.3-linux-amd64 -O /usr/local/bin/sampler sudo chmod +x /usr/local/bin/sampler
жіЁж„ҸпјҡйңҖиҰҒдёәSamplerе®үиЈ…libasound2-devзі»з»ҹеә“з”Ёд»Ҙж’ӯж”ҫи§ҰеҸ‘еҷЁеЈ°йҹігҖӮйҖҡеёёеә“е·Іе®үиЈ…еңЁзӣёеә”дҪҚзҪ®пјҢдҪҶеҰӮжһңжІЎжңү – дҪ еҸҜд»ҘдҪҝз”ЁдҪ д№ жғҜзҡ„еҢ…з®ЎзҗҶеҷЁиҝӣиЎҢе®үиЈ…пјҢдҫӢеҰӮapt install libasound2-dev
WindowsпјҲе®һйӘҢпјү
е»әи®®еңЁй«ҳзә§жҺ§еҲ¶еҸ°жЁЎжӢҹеҷЁдёӢдҪҝз”ЁпјҢеҰӮCmder
Download .exe
дҪҝз”Ё
жҢҮе®ҡshellе‘Ҫд»ӨпјҢSamplerдјҡзӣёеә”зҡ„йҖҹзҺҮжү§иЎҢиҝҷдәӣе‘Ҫд»ӨгҖӮиҫ“еҮәз”ЁдәҺеҸҜи§ҶеҢ–гҖӮ
дҪҝз”ЁSamplerеҹәжң¬дёҠзҡ„дёүжӯҘиҝҮзЁӢпјҡ
еңЁYAMLй…ҚзҪ®ж–Ү件дёӯе®ҡд№үshellе‘Ҫд»Ө
иҝҗиЎҢsampler -c config.yml
еңЁUIдёҠи°ғж•ҙ组件еӨ§е°Ҹе’ҢдҪҚзҪ®
еёӮйқўж—©е·Іжңүи®ёеӨҡзӣ‘жҺ§зі»з»ҹ
Samplerз»қдёҚжҳҜзӣ‘жҺ§зі»з»ҹзҡ„жӣҝд»Је“ҒпјҢиҖҢжҳҜжҳ“дәҺи®ҫзҪ®зҡ„ејҖеҸ‘е·Ҙе…·гҖӮ
еҰӮжһңspinning upе’ҢдҪҝз”ЁGrafanaй…ҚзҪ®PrometheusжҳҜе®Ңе…ЁеӨҡдҪҷзҡ„д»»еҠЎпјҢйӮЈд№ҲSamplerеҸҜиғҪжҳҜжӯЈзЎ®зҡ„и§ЈеҶіж–№жЎҲгҖӮжІЎжңүжңҚеҠЎеҷЁпјҢжІЎжңүж•°жҚ®еә“пјҢдёҚйңҖиҰҒйғЁзҪІ – дҪ жҢҮе®ҡдәҶshellе‘Ҫд»ӨпјҢе®ғе°ұеҸҜд»Ҙе·ҘдҪңдәҶгҖӮ
жҲ‘зӣ‘жҺ§зҡ„жҜҸеҸ°жңҚеҠЎеҷЁдёҠйғҪйңҖиҰҒе®үиЈ…еҗ—пјҹ
дёҚпјҢдҪ еҸҜд»ҘеңЁжң¬ең°иҝҗиЎҢSamplerпјҢдҪҶд»Қ然еҸҜд»Ҙд»ҺеӨҡеҸ°иҝңзЁӢи®Ўз®—жңәдёҠ收йӣҶйҒҘжөӢж•°жҚ®гҖӮд»»дҪ•еҸҜи§ҶеҢ–йғҪеҸҜиғҪе…·жңүinitе‘Ҫд»ӨпјҢдҪ еҸҜд»ҘеңЁе…¶дёӯsshеҲ°иҝңзЁӢжңҚеҠЎеҷЁгҖӮиҜ·еҸӮйҳ…SSH example
组件
д»ҘдёӢжҳҜжҜҸз§Қ组件зұ»еһӢзҡ„й…ҚзҪ®зӨәдҫӢеҲ—иЎЁпјҢе…¶дёӯеҢ…еҗ«дёҺmacOSе…је®№зҡ„йҮҮж ·и„ҡжң¬гҖӮ
Runchart

runcharts: - title: Search engine response time rate-ms: 500 # sampling rate, default = 1000 scale: 2 # number of digits after sample decimal point, default = 1 legend: enabled: true # enables item labels, default = true details: false # enables item statistics: cur/min/max/dlt values, default = true items: - label: GOOGLE sample: curl -o /dev/null -s -w '%{time_total}' https://www.google.com color: 178 # 8-bit color number, default one is chosen from a pre-defined palette - label: YAHOO sample: curl -o /dev/null -s -w '%{time_total}' https://search.yahoo.com - label: BING sample: curl -o /dev/null -s -w '%{time_total}' https://www.bing.comSparkline
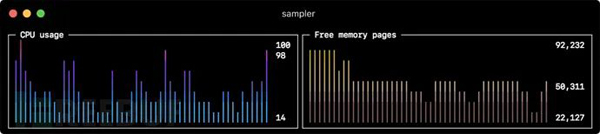
sparklines: - title: CPU usage rate-ms: 200 scale: 0 sample: ps -A -o %cpu | awk '{s+=$1} END {print s}' - title: Free memory pages rate-ms: 200 scale: 0 sample: memory_pressure | grep 'Pages free' | awk '{print $3}'Barchart
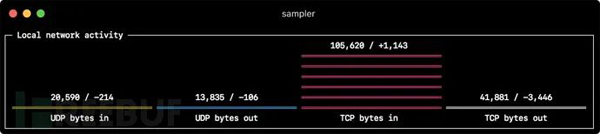
barcharts: - title: Local network activity rate-ms: 500 # sampling rate, default = 1000 scale: 0 # number of digits after sample decimal point, default = 1 items: - label: UDP bytes in sample: nettop -J bytes_in -l 1 -m udp | awk '{sum += $4} END {print sum}' - label: UDP bytes out sample: nettop -J bytes_out -l 1 -m udp | awk '{sum += $4} END {print sum}' - label: TCP bytes in sample: nettop -J bytes_in -l 1 -m tcp | awk '{sum += $4} END {print sum}' - label: TCP bytes out sample: nettop -J bytes_out -l 1 -m tcp | awk '{sum += $4} END {print sum}'Gauge

gauges: - title: Minute progress rate-ms: 500 # sampling rate, default = 1000 scale: 2 # number of digits after sample decimal point, default = 1 percent-only: false # toggle display of the current value, default = false color: 178 # 8-bit color number, default one is chosen from a pre-defined palette cur: sample: date +%S # sample script for current value max: sample: echo 60 # sample script for max value min: sample: echo 0 # sample script for min value - title: Year progress cur: sample: date +%j max: sample: echo 365 min: sample: echo 0
Textbox
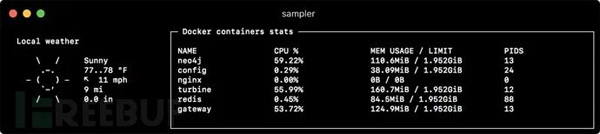
textboxes: - title: Local weather rate-ms: 10000 # sampling rate, default = 1000 sample: curl wttr.in?0ATQF border: false # border around the item, default = true color: 178 # 8-bit color number, default is white - title: Docker containers stats rate-ms: 500 sample: docker stats --no-stream --format "table {{.Name}}\t{{.CPUPerc}}\t{{.MemUsage}}\t{{.PIDs}}"Asciibox

asciiboxes: - title: UTC time rate-ms: 500 # sampling rate, default = 1000 font: 3d # font type, default = 2d border: false # border around the item, default = true color: 43 # 8-bit color number, default is white sample: env TZ=UTC date +%r
йўқеӨ–еҠҹиғҪ
Triggers
и§ҰеҸ‘еҷЁе…Ғи®ёжү§иЎҢжқЎд»¶ж“ҚдҪңпјҢеҰӮи§Ҷи§ү/еЈ°йҹіе‘ҠиӯҰжҲ–д»»ж„Ҹshellе‘Ҫд»ӨгҖӮд»ҘдёӢзӨәдҫӢиҜҙжҳҺдәҶжӯӨжҰӮеҝөгҖӮ
Clock gaugeпјҢд»ҺејҖе§Ӣзҡ„жҜҸеҲҶй’ҹжҳҫзӨәж—¶й—ҙиҝӣеәҰе’ҢеҪ“еүҚж—¶й—ҙ
gauges: - title: MINUTE PROGRESS position: [[0, 18], [80, 0]] cur: sample: date +%S max: sample: echo 60 min: sample: echo 0 triggers: - title: CLOCK BELL EVERY MINUTE condition: '[ $label == "cur" ] && [ $cur -eq 0 ] && echo 1 || echo 0' # expects "1" as TRUE indicator actions: terminal-bell: true # standard terminal bell, default = false sound: true # NASA quindar tone, default = false visual: false # notification with current value on top of the component area, default = false script: say -v samantha `date +%I:%M%p` # an arbitrary script, which can use $cur, $prev and $label variables
жҗңзҙўеј•ж“Һ延иҝҹеӣҫиЎЁпјҢеңЁе»¶иҝҹи¶…иҝҮйҳҲеҖјж—¶еҗ‘з”ЁжҲ·еҸ‘еҮәе‘ҠиӯҰ
runcharts: - title: SEARCH ENGINE RESPONSE TIME (sec) rate-ms: 200 items: - label: GOOGLE sample: curl -o /dev/null -s -w '%{time_total}' https://www.google.com - label: YAHOO sample: curl -o /dev/null -s -w '%{time_total}' https://search.yahoo.com triggers: - title: Latency threshold exceeded condition: echo "$prev < 0.3 && $cur > 0.3" |bc -l # expects "1" as TRUE indicator actions: terminal-bell: true # standard terminal bell, default = false sound: true # NASA quindar tone, default = false visual: true # visual notification on top of the component area, default = false script: 'say alert: ${label} latency exceeded ${cur} second' # an arbitrary script, which can use $cur, $prev and $label variablesдәӨдә’ејҸ shell ж”ҜжҢҒ
йҷӨдәҶsampleе‘Ҫд»Өд№ӢеӨ–пјҢиҝҳеҸҜд»ҘжҢҮе®ҡinitе‘Ҫд»ӨпјҲеңЁйҮҮж ·еүҚд»…жү§иЎҢдёҖж¬Ўпјүе’Ңtransformе‘Ҫд»ӨпјҲеҗҺеӨ„зҗҶйҮҮж ·е‘Ҫд»Өиҫ“еҮәпјүгҖӮиҝҷеҢ…жӢ¬дәӨдә’ејҸshellз”ЁдҫӢпјҢдҫӢеҰӮд»…е»әз«ӢдёҺж•°жҚ®еә“зҡ„иҝһжҺҘдёҖж¬ЎпјҢ然еҗҺеңЁдәӨдә’ејҸshellдјҡиҜқдёӯжү§иЎҢиҪ®иҜўгҖӮ
Basic mode
textboxes: - title: MongoDB polling rate-ms: 500 init: mongo --quiet --host=localhost test # executes only once to start the interactive session sample: Date.now(); # executes with a required rate, in scope of the interactive session transform: echo result = $sample # executes in scope of local session, $sample variable is available for transformation
PTY mode
еңЁжҹҗдәӣжғ…еҶөдёӢпјҢдәӨдә’ејҸshellе°Ҷж— жі•е·ҘдҪңпјҢеӣ дёәе®ғзҡ„stdinдёҚжҳҜз»Ҳз«ҜгҖӮиҝҷз§Қжғ…еҶөдёӢжҲ‘们еҸҜд»ҘдҪҝз”ЁPTYжЁЎејҸпјҡ
textboxes: - title: Neo4j polling pty: true # enables pseudo-terminal mode, default = false init: cypher-shell -u neo4j -p pwd --format plain sample: RETURN rand(); transform: echo "$sample" | tail -n 1 - title: Top on a remote server pty: true # enables pseudo-terminal mode, default = false init: ssh -i ~/user.pem ec2-user@1.2.3.4 sample: top
init е‘Ҫд»ӨйҖҗжӯҘжү§иЎҢ
еңЁејҖе§ӢйҮҮж ·д№ӢеүҚпјҢиҝҳеҸҜд»ҘйҖҗдёӘжү§иЎҢеӨҡдёӘinitе‘Ҫд»ӨгҖӮ
textboxes: - title: Java application uptime multistep-init: - java -jar jmxterm-1.0.0-uber.jar - open host:port # or local PID - bean java.lang:type=Runtime sample: get Uptime
еҸҳйҮҸ
еҰӮжһңй…ҚзҪ®ж–Ү件еҢ…еҗ«йҮҚеӨҚзҡ„жЁЎејҸпјҢеҲҷеҸҜд»Ҙе°Ҷе®ғ们жҸҗеҸ–еҲ°еҸҳйҮҸйғЁеҲҶгҖӮжӯӨеӨ–пјҢиҝҳеҸҜд»ҘеңЁеҗҜеҠЁж—¶дҪҝз”Ё-v/–variableж Үеҝ—жҢҮе®ҡеҸҳйҮҸпјҢ并且任ж„Ҹзҡ„зі»з»ҹзҺҜеўғеҸҳйҮҸд№ҹеҸҜд»ҘеңЁи„ҡжң¬дёӯдҪҝз”ЁгҖӮ
variables: mongoconnection: mongo --quiet --host=localhost test barcharts: - title: MongoDB documents by status items: - label: IN_PROGRESS init: $mongoconnection sample: db.getCollection('events').find({status:'IN_PROGRESS'}).count() - label: SUCCESS init: $mongoconnection sample: db.getCollection('events').find({status:'SUCCESS'}).count() - label: FAIL init: $mongoconnection sample: db.getCollection('events').find({status:'FAIL'}).count()йўңиүІдё»йўҳ
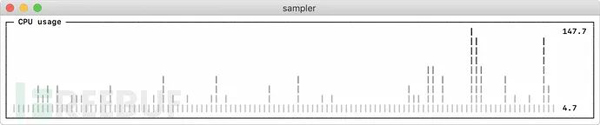
theme: light # default = dark sparklines: - title: CPU usage sample: ps -A -o %cpu | awk '{s+=$1} END {print s}'зңҹе®һеңәжҷҜ
ж•°жҚ®еә“
д»ҘдёӢжҳҜдёҚеҗҢзҡ„ж•°жҚ®еә“иҝһжҺҘзӨәдҫӢгҖӮе»әи®®дҪҝз”ЁдәӨдә’ејҸshellпјҲinitи„ҡжң¬пјүд»…е»әз«ӢдёҖж¬ЎиҝһжҺҘпјҢ然еҗҺеңЁйҮҮж ·жңҹй—ҙйҮҚз”ЁеҚіеҸҜгҖӮ
# prerequisite: installed mysql shell variables: mysql_connection: mysql -u root -s --database mysql --skip-column-names sparklines: - title: MySQL (random number example) pty: true init: $mysql_connection sample: select rand();
PostgreSQL
# prerequisite: installed psql shell variables: PGPASSWORD: pwd postgres_connection: psql -h localhost -U postgres --no-align --tuples-only sparklines: - title: PostgreSQL (random number example) init: $postgres_connection sample: select random();
MongoDB
# prerequisite: installed mongo shell variables: mongo_connection: mongo --quiet --host=localhost test sparklines: - title: MongoDB (random number example) init: $mongo_connection sample: Math.random();
Neo4j
# prerequisite: installed cypher shell variables: neo4j_connection: cypher-shell -u neo4j -p pwd --format plain sparklines: - title: Neo4j (random number example) pty: true init: $neo4j_connection sample: RETURN rand(); transform: echo "$sample" | tail -n 1
Kafka
жЈҖжҹҘkafka lagеҖјпјҢи®Ўз®—жҜҸдёӘйҳҹеҲ—lagеҖјзҡ„е’ҢпјҢй«ҳдәҺйҳҲеҖјжҠҘиӯҰпјҢеӨҡconsumergroupпјҢеӨҡtopicгҖӮ
variables: kafka_connection: $KAFKA_HOME/bin/kafka-consumer-groups --bootstrap-server localhost:9092 runcharts: - title: Kafka lag per consumer group rate-ms: 5000 scale: 0 items: - label: A->B sample: $kafka_connection --group group_a --describe | awk 'NR>1 {sum += $5} END {print sum}' - label: B->C sample: $kafka_connection --group group_b --describe | awk 'NR>1 {sum += $5} END {print sum}' - label: C->D sample: $kafka_connection --group group_c --describe | awk 'NR>1 {sum += $5} END {print sum}'Docker
Dockerе®№еҷЁз»ҹи®ЎдҝЎжҒҜпјҲCPUпјҢMEMпјҢO/Iпјү
textboxes: - title: Docker containers stats sample: docker stats --no-stream --format "table {{.Name}}\t{{.CPUPerc}}\t{{.MemPerc}}\t{{.MemUsage}}\t{{.NetIO}}\t{{.BlockIO}}\t{{.PIDs}}"SSH
иҝңзЁӢжңҚеҠЎеҷЁдёҠзҡ„TOPе‘Ҫд»Ө
variables: sshconnection: ssh -i ~/my-key-pair.pem ec2-user@1.2.3.4 textboxes: - title: SSH pty: true init: $sshconnection sample: top
JMX
Javaеә”з”ЁзЁӢеәҸзҡ„жӯЈеёёиҝҗиЎҢзӨәдҫӢ
# prerequisite: download [jmxterm jar file](https://docs.cyclopsgroup.org/jmxterm) textboxes: - title: Java application uptime multistep-init: - java -jar jmxterm-1.0.0-uber.jar - open host:port # or local PID - bean java.lang:type=Runtime sample: get Uptime transform: echo $sample | tr -dc '0-9' | awk '{printf "%.1f min", $1/1000/60}'д»ҘдёҠжҳҜвҖңShellдёӯSamplerжңүд»Җд№Ҳз”ЁвҖқиҝҷзҜҮж–Үз« зҡ„жүҖжңүеҶ…е®№пјҢж„ҹи°ўеҗ„дҪҚзҡ„йҳ…иҜ»пјҒеёҢжңӣеҲҶдә«зҡ„еҶ…е®№еҜ№еӨ§е®¶жңүеё®еҠ©пјҢжӣҙеӨҡзӣёе…ізҹҘиҜҶпјҢж¬ўиҝҺе…іжіЁдәҝйҖҹдә‘иЎҢдёҡиө„и®Ҝйў‘йҒ“пјҒ
е…ҚиҙЈеЈ°жҳҺпјҡжң¬з«ҷеҸ‘еёғзҡ„еҶ…е®№пјҲеӣҫзүҮгҖҒи§Ҷйў‘е’Ңж–Үеӯ—пјүд»ҘеҺҹеҲӣгҖҒиҪ¬иҪҪе’ҢеҲҶдә«дёәдё»пјҢж–Үз« и§ӮзӮ№дёҚд»ЈиЎЁжң¬зҪ‘з«ҷз«ӢеңәпјҢеҰӮжһңж¶үеҸҠдҫөжқғиҜ·иҒ”зі»з«ҷй•ҝйӮ®з®ұпјҡis@yisu.comиҝӣиЎҢдёҫжҠҘпјҢ并жҸҗдҫӣзӣёе…іиҜҒжҚ®пјҢдёҖз»ҸжҹҘе®һпјҢе°Ҷз«ӢеҲ»еҲ йҷӨж¶үе«ҢдҫөжқғеҶ…е®№гҖӮ
жӮЁеҘҪпјҢзҷ»еҪ•еҗҺжүҚиғҪдёӢи®ўеҚ•е“ҰпјҒ