您好,登录后才能下订单哦!
密码登录
登录注册
点击 登录注册 即表示同意《亿速云用户服务条款》
本篇内容介绍了“如何进行数据采集和数据上报”的有关知识,在实际案例的操作过程中,不少人都会遇到这样的困境,接下来就让小编带领大家学习一下如何处理这些情况吧!希望大家仔细阅读,能够学有所成!
数据采集
性能数据采集
性能数据采集需要使用 window.performance API
https://developer.mozilla.org/zh-CN/docs/Web/API/Performance
Performance 接口可以获取到当前页面中与性能相关的信息,它是 High Resolution Time API 的一部分,同时也融合了 Performance Timeline API、Navigation Timing API、 User Timing API 和 Resource Timing API。
从 MDN 的文档可以看出,window.performance.timing 包含了页面加载各个阶段的起始及结束时间。
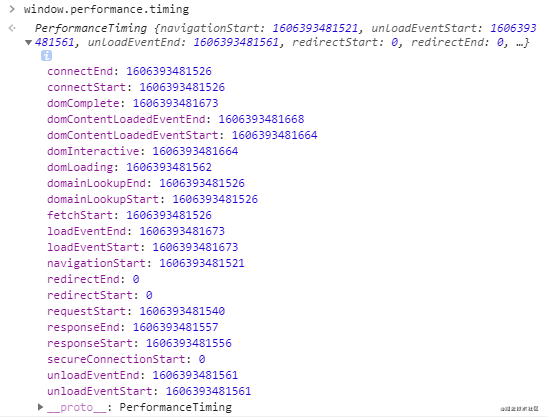
这些属性需要结合下图一起看,更好理解:
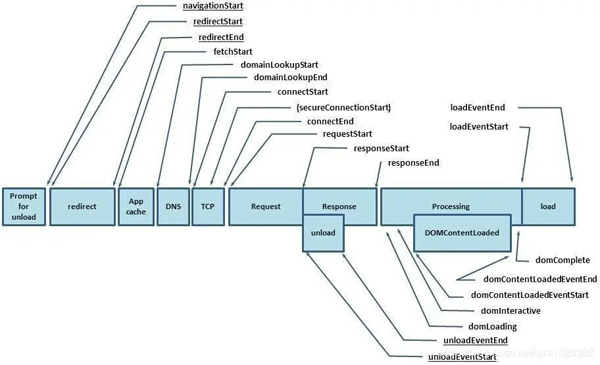
在这里插入图片描述
为了方便大家理解 timing 各个属性的意义,我在知乎找到一位网友对于 timing 写的简介,在此转载一下。
timing: { // 同一个浏览器上一个页面卸载(unload)结束时的时间戳。如果没有上一个页面,这个值会和fetchStart相同。 navigationStart: 1543806782096, // 上一个页面unload事件抛出时的时间戳。如果没有上一个页面,这个值会返回0。 unloadEventStart: 1543806782523, // 和 unloadEventStart 相对应,unload事件处理完成时的时间戳。如果没有上一个页面,这个值会返回0。 unloadEventEnd: 1543806782523, // 第一个HTTP重定向开始时的时间戳。如果没有重定向,或者重定向中的一个不同源,这个值会返回0。 redirectStart: 0, // 最后一个HTTP重定向完成时(也就是说是HTTP响应的最后一个比特直接被收到的时间)的时间戳。 // 如果没有重定向,或者重定向中的一个不同源,这个值会返回0. redirectEnd: 0, // 浏览器准备好使用HTTP请求来获取(fetch)文档的时间戳。这个时间点会在检查任何应用缓存之前。 fetchStart: 1543806782096, // DNS 域名查询开始的UNIX时间戳。 //如果使用了持续连接(persistent connection),或者这个信息存储到了缓存或者本地资源上,这个值将和fetchStart一致。 domainLookupStart: 1543806782096, // DNS 域名查询完成的时间. //如果使用了本地缓存(即无 DNS 查询)或持久连接,则与 fetchStart 值相等 domainLookupEnd: 1543806782096, // HTTP(TCP) 域名查询结束的时间戳。 //如果使用了持续连接(persistent connection),或者这个信息存储到了缓存或者本地资源上,这个值将和 fetchStart一致。 connectStart: 1543806782099, // HTTP(TCP) 返回浏览器与服务器之间的连接建立时的时间戳。 // 如果建立的是持久连接,则返回值等同于fetchStart属性的值。连接建立指的是所有握手和认证过程全部结束。 connectEnd: 1543806782227, // HTTPS 返回浏览器与服务器开始安全链接的握手时的时间戳。如果当前网页不要求安全连接,则返回0。 secureConnectionStart: 1543806782162, // 返回浏览器向服务器发出HTTP请求时(或开始读取本地缓存时)的时间戳。 requestStart: 1543806782241, // 返回浏览器从服务器收到(或从本地缓存读取)第一个字节时的时间戳。 //如果传输层在开始请求之后失败并且连接被重开,该属性将会被数制成新的请求的相对应的发起时间。 responseStart: 1543806782516, // 返回浏览器从服务器收到(或从本地缓存读取,或从本地资源读取)最后一个字节时 //(如果在此之前HTTP连接已经关闭,则返回关闭时)的时间戳。 responseEnd: 1543806782537, // 当前网页DOM结构开始解析时(即Document.readyState属性变为“loading”、相应的 readystatechange事件触发时)的时间戳。 domLoading: 1543806782573, // 当前网页DOM结构结束解析、开始加载内嵌资源时(即Document.readyState属性变为“interactive”、相应的readystatechange事件触发时)的时间戳。 domInteractive: 1543806783203, // 当解析器发送DOMContentLoaded 事件,即所有需要被执行的脚本已经被解析时的时间戳。 domContentLoadedEventStart: 1543806783203, // 当所有需要立即执行的脚本已经被执行(不论执行顺序)时的时间戳。 domContentLoadedEventEnd: 1543806783216, // 当前文档解析完成,即Document.readyState 变为 'complete'且相对应的readystatechange 被触发时的时间戳 domComplete: 1543806783796, // load事件被发送时的时间戳。如果这个事件还未被发送,它的值将会是0。 loadEventStart: 1543806783796, // 当load事件结束,即加载事件完成时的时间戳。如果这个事件还未被发送,或者尚未完成,它的值将会是0. loadEventEnd: 1543806783802 }通过以上数据,我们可以得到几个有用的时间
// 重定向耗时 redirect: timing.redirectEnd - timing.redirectStart, // DOM 渲染耗时 dom: timing.domComplete - timing.domLoading, // 页面加载耗时 load: timing.loadEventEnd - timing.navigationStart, // 页面卸载耗时 unload: timing.unloadEventEnd - timing.unloadEventStart, // 请求耗时 request: timing.responseEnd - timing.requestStart, // 获取性能信息时当前时间 time: new Date().getTime(),
还有一个比较重要的时间就是白屏时间,它指从输入网址,到页面开始显示内容的时间。
将以下脚本放在 </head> 前面就能获取白屏时间。
<script> whiteScreen = new Date() - performance.timing.navigationStart // 通过 domLoading 和 navigationStart 也可以 whiteScreen = performance.timing.domLoading - performance.timing.navigationStart </script>
通过这几个时间,就可以得知页面首屏加载性能如何了。
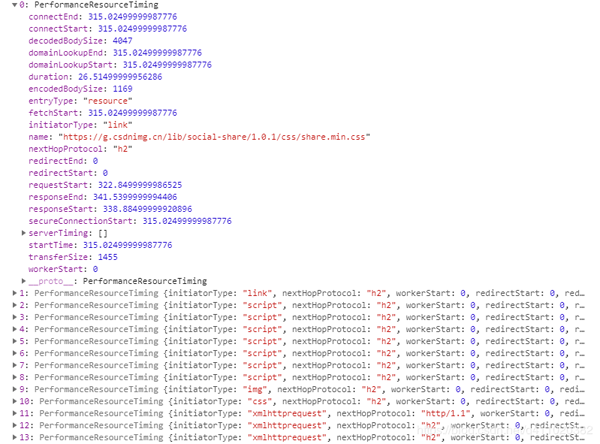
另外,通过 window.performance.getEntriesByType('resource') 这个方法,我们还可以获取相关资源(js、css、img...)的加载时间,它会返回页面当前所加载的所有资源。
在这里插入图片描述
它一般包括以下几个类型:
sciprt
link
img
css
fetch
other
xmlhttprequest
我们只需用到以下几个信息:
// 资源的名称 name: item.name, // 资源加载耗时 duration: item.duration.toFixed(2), // 资源大小 size: item.transferSize, // 资源所用协议 protocol: item.nextHopProtocol,
现在,写几行代码来收集这些数据。
// 收集性能信息 const getPerformance = () => { if (!window.performance) return const timing = window.performance.timing const performance = { // 重定向耗时 redirect: timing.redirectEnd - timing.redirectStart, // 白屏时间 whiteScreen: whiteScreen, // DOM 渲染耗时 dom: timing.domComplete - timing.domLoading, // 页面加载耗时 load: timing.loadEventEnd - timing.navigationStart, // 页面卸载耗时 unload: timing.unloadEventEnd - timing.unloadEventStart, // 请求耗时 request: timing.responseEnd - timing.requestStart, // 获取性能信息时当前时间 time: new Date().getTime(), } return performance } // 获取资源信息 const getResources = () => { if (!window.performance) return const data = window.performance.getEntriesByType('resource') const resource = { xmlhttprequest: [], css: [], other: [], script: [], img: [], link: [], fetch: [], // 获取资源信息时当前时间 time: new Date().getTime(), } data.forEach(item => { const arry = resource[item.initiatorType] arry && arry.push({ // 资源的名称 name: item.name, // 资源加载耗时 duration: item.duration.toFixed(2), // 资源大小 size: item.transferSize, // 资源所用协议 protocol: item.nextHopProtocol, }) }) return resource }小结
通过对性能及资源信息的解读,我们可以判断出页面加载慢有以下几个原因:
鸿蒙官方战略合作共建——HarmonyOS技术社区
资源过多、过大
网速过慢
DOM 元素过多
除了用户网速过慢,我们没办法之外,其他两个原因都是有办法解决的,性能优化的文章和书籍网上已经有很多了,有兴趣可自行查找资料了解。
PS:其实页面加载慢还有其他原因,例如没有使用按需加载、没有使用 CDN 等等。不过这里我们强调的仅通过对性能和资源信息的解读来获取原因。
错误数据采集
目前所能捕捉的错误有三种:
鸿蒙官方战略合作共建——HarmonyOS技术社区
资源加载错误,通过 addEventListener('error', callback, true) 在捕获阶段捕捉资源加载失败错误。
js 执行错误,通过 window.onerror 捕捉 js 错误。
promise 错误,通过 addEventListener('unhandledrejection', callback)捕捉 promise 错误,但是没有发生错误的行数,列数等信息,只能手动抛出相关错误信息。
我们可以建一个错误数组变量 errors 在错误发生时,将错误的相关信息添加到数组,然后在某个阶段统一上报,具体如何操作请看下面的代码:
// 捕获资源加载失败错误 js css img... addEventListener('error', e => { const target = e.target if (target != window) { monitor.errors.push({ type: target.localName, url: target.src || target.href, msg: (target.src || target.href) + ' is load error', // 错误发生的时间 time: new Date().getTime(), }) } }, true) // 监听 js 错误 window.onerror = function(msg, url, row, col, error) { monitor.errors.push({ type: 'javascript', row: row, col: col, msg: error && error.stack? error.stack : msg, url: url, // 错误发生的时间 time: new Date().getTime(), }) } // 监听 promise 错误 缺点是获取不到行数数据 addEventListener('unhandledrejection', e => { monitor.errors.push({ type: 'promise', msg: (e.reason && e.reason.msg) || e.reason || '', // 错误发生的时间 time: new Date().getTime(), }) })小结
通过错误收集,可以了解到网站发生错误的类型及数量,从而做出相应的调整,以减少错误发生。完整代码和 DEMO 会在文章末尾放出,大家可以复制代码(HTML文件)在本地测试一下。
数据上报
性能数据上报
性能数据可以在页面加载完之后上报,尽量不要对页面性能造成影响。
window.onload = () => { // 在浏览器空闲时间获取性能及资源信息 // https://developer.mozilla.org/zh-CN/docs/Web/API/Window/requestIdleCallback if (window.requestIdleCallback) { window.requestIdleCallback(() => { monitor.performance = getPerformance() monitor.resources = getResources() }) } else { setTimeout(() => { monitor.performance = getPerformance() monitor.resources = getResources() }, 0) } }当然,你也可以设一个定时器,循环上报。不过每次上报最好做一下对比去重再上报,避免同样的数据重复上报。
错误数据上报
我在 DEMO 里提供的代码,是用一个 errors 数组收集所有的错误,再在某一阶段统一上报(延时上报)。
其实,也可以改成在错误发生时上报(即时上报)。这样可以避免“收集完错误,但延时上报还没触发,用户却已经关掉网页导致错误数据丢失”的问题。
// 监听 js 错误 window.onerror = function(msg, url, row, col, error) { const data = { type: 'javascript', row: row, col: col, msg: error && error.stack? error.stack : msg, url: url, // 错误发生的时间 time: new Date().getTime(), } // 即时上报 axios.post({ url: 'xxx', data, }) }经网友提醒,可以使用 navigator.sendBeacon() 来进行上报。
window.addEventListener('unload', logData, false); function logData() { navigator.sendBeacon("/log", analyticsData); }它的技术特点是:
使用 sendBeacon() 方法会使用户代理(浏览器)在有机会时异步地向服务器发送数据,同时不会延迟页面的卸载或影响下一导航的载入性能。这就解决了提交分析数据时的所有的问题:数据可靠,传输异步并且不会影响下一页面的加载。
扩展
SPA
window.performance API 是有缺点的,在 SPA 切换路由时,window.performance.timing 的数据不会更新。所以我们需要另想办法来统计切换路由到加载完成的时间。拿 Vue 举例,一个可行的办法就是切换路由时,在路由的全局前置守卫 beforeEach 里获取开始时间,在组件的 mounted 钩子里执行 vm.$nextTick 函数来获取组件的渲染完毕时间。
router.beforeEach((to, from, next) => { store.commit('setPageLoadedStartTime', new Date()) })mounted() { this.$nextTick(() => { this.$store.commit('setPageLoadedTime', new Date() - this.$store.state.pageLoadedStartTime) }) }除了性能和错误监控,其实我们还可以收集更多的信息。
用户信息收集
navigator
使用 window.navigator 可以收集到用户的设备信息,操作系统,浏览器信息...
UV(Unique visitor)
是指通过互联网浏览这个网页的访客,00:00-24:00 内相同的设备访问只被计算一次。一天内同个访客多次访问仅计算一个 UV。
在用户访问网站时,可以生成一个随机字符串+时间日期,保存在本地。在网页发生请求时(如果超过当天24小时,则重新生成),把这些参数传到后端,后端利用这些信息生成 UV 统计报告。
PV(Page View)
即页面浏览量或点击量,用户每 1 次对网站中的每个网页访问均被记录 1 个PV。用户对同一页面的多次访问,访问量累计,用以衡量网站用户访问的网页数量。
页面停留时间
传统网站
用户在进入 A 页面时,通过后台请求把用户进入页面的时间捎上。过了 10 分钟,用户进入 B 页面,这时后台可以通过接口捎带的参数可以判断出用户在 A 页面停留了 10 分钟。
SPA
可以利用 router 来获取用户停留时间,拿 Vue 举例,通过 router.beforeEach、destroyed 这两个钩子函数来获取用户停留该路由组件的时间。
浏览深度
通过 document.documentElement.scrollTop 属性以及屏幕高度,可以判断用户是否浏览完网站内容。
页面跳转来源
通过 document.referrer 属性,可以知道用户是从哪个网站跳转而来。
小结
通过分析用户数据,我们可以了解到用户的浏览习惯、爱好等等信息,想想真是恐怖,毫无隐私可言。
DEMO
<!DOCTYPE html> <html> <head> <meta charset="UTF-8"> <meta name="viewport" content="width=device-width, initial-scale=1.0"> <meta http-equiv="X-UA-Compatible" content="ie=edge"> <script> function monitorInit() { const monitor = { // 数据上传地址 url: '', // 性能信息 performance: {}, // 资源信息 resources: {}, // 错误信息 errors: [], // 用户信息 user: { // 屏幕宽度 screen: screen.width, // 屏幕高度 height: screen.height, // 浏览器平台 platform: navigator.platform, // 浏览器的用户代理信息 userAgent: navigator.userAgent, // 浏览器用户界面的语言 language: navigator.language, }, // 手动添加错误 addError(error) { const obj = {} const { type, msg, url, row, col } = error if (type) obj.type = type if (msg) obj.msg = msg if (url) obj.url = url if (row) obj.row = row if (col) obj.col = col obj.time = new Date().getTime() monitor.errors.push(obj) }, // 重置 monitor 对象 reset() { window.performance && window.performance.clearResourceTimings() monitor.performance = getPerformance() monitor.resources = getResources() monitor.errors = [] }, // 清空 error 信息 clearError() { monitor.errors = [] }, // 上传监控数据 upload() { // 自定义上传 // axios.post({ // url: monitor.url, // data: { // performance, // resources, // errors, // user, // } // }) }, // 设置数据上传地址 setURL(url) { monitor.url = url }, } // 获取性能信息 const getPerformance = () => { if (!window.performance) return const timing = window.performance.timing const performance = { // 重定向耗时 redirect: timing.redirectEnd - timing.redirectStart, // 白屏时间 whiteScreen: whiteScreen, // DOM 渲染耗时 dom: timing.domComplete - timing.domLoading, // 页面加载耗时 load: timing.loadEventEnd - timing.navigationStart, // 页面卸载耗时 unload: timing.unloadEventEnd - timing.unloadEventStart, // 请求耗时 request: timing.responseEnd - timing.requestStart, // 获取性能信息时当前时间 time: new Date().getTime(), } return performance } // 获取资源信息 const getResources = () => { if (!window.performance) return const data = window.performance.getEntriesByType('resource') const resource = { xmlhttprequest: [], css: [], other: [], script: [], img: [], link: [], fetch: [], // 获取资源信息时当前时间 time: new Date().getTime(), } data.forEach(item => { const arry = resource[item.initiatorType] arry && arry.push({ // 资源的名称 name: item.name, // 资源加载耗时 duration: item.duration.toFixed(2), // 资源大小 size: item.transferSize, // 资源所用协议 protocol: item.nextHopProtocol, }) }) return resource } window.onload = () => { // 在浏览器空闲时间获取性能及资源信息 https://developer.mozilla.org/zh-CN/docs/Web/API/Window/requestIdleCallback if (window.requestIdleCallback) { window.requestIdleCallback(() => { monitor.performance = getPerformance() monitor.resources = getResources() console.log('页面性能信息') console.log(monitor.performance) console.log('页面资源信息') console.log(monitor.resources) }) } else { setTimeout(() => { monitor.performance = getPerformance() monitor.resources = getResources() console.log('页面性能信息') console.log(monitor.performance) console.log('页面资源信息') console.log(monitor.resources) }, 0) } } // 捕获资源加载失败错误 js css img... addEventListener('error', e => { const target = e.target if (target != window) { monitor.errors.push({ type: target.localName, url: target.src || target.href, msg: (target.src || target.href) + ' is load error', // 错误发生的时间 time: new Date().getTime(), }) console.log('所有的错误信息') console.log(monitor.errors) } }, true) // 监听 js 错误 window.onerror = function(msg, url, row, col, error) { monitor.errors.push({ type: 'javascript', // 错误类型 row: row, // 发生错误时的代码行数 col: col, // 发生错误时的代码列数 msg: error && error.stack? error.stack : msg, // 错误信息 url: url, // 错误文件 time: new Date().getTime(), // 错误发生的时间 }) console.log('所有的错误信息') console.log(monitor.errors) } // 监听 promise 错误 缺点是获取不到行数数据 addEventListener('unhandledrejection', e => { monitor.errors.push({ type: 'promise', msg: (e.reason && e.reason.msg) || e.reason || '', // 错误发生的时间 time: new Date().getTime(), }) console.log('所有的错误信息') console.log(monitor.errors) }) return monitor } const monitor = monitorInit() </script> <link rel="stylesheet" href="test.css"> <title>Document</title> </head> <body> <button class="btn1">错误测试按钮1</button> <button class="btn2">错误测试按钮2</button> <button class="btn3">错误测试按钮3</button> <img src="https://avatars3.githubusercontent.com/u/22117876?s=460&v=4" alt=""> <img src="test.png" alt=""> <script src="192.168.10.15/test.js"></script> <script> document.querySelector('.btn1').onclick = () => { setTimeout(() => { console.log(button) }, 0) } document.querySelector('.btn2').onclick = () => { new Promise((resolve, reject) => { reject({ msg: 'test.js promise is error' }) }) } document.querySelector('.btn3').onclick = () => { throw ('这是一个手动扔出的错误') } </script> </body> </html>“如何进行数据采集和数据上报”的内容就介绍到这里了,感谢大家的阅读。如果想了解更多行业相关的知识可以关注亿速云网站,小编将为大家输出更多高质量的实用文章!
免责声明:本站发布的内容(图片、视频和文字)以原创、转载和分享为主,文章观点不代表本网站立场,如果涉及侵权请联系站长邮箱:is@yisu.com进行举报,并提供相关证据,一经查实,将立刻删除涉嫌侵权内容。