您好,登录后才能下订单哦!
密码登录
登录注册
点击 登录注册 即表示同意《亿速云用户服务条款》
官网:
https://www.elastic.co/cn/中文指南
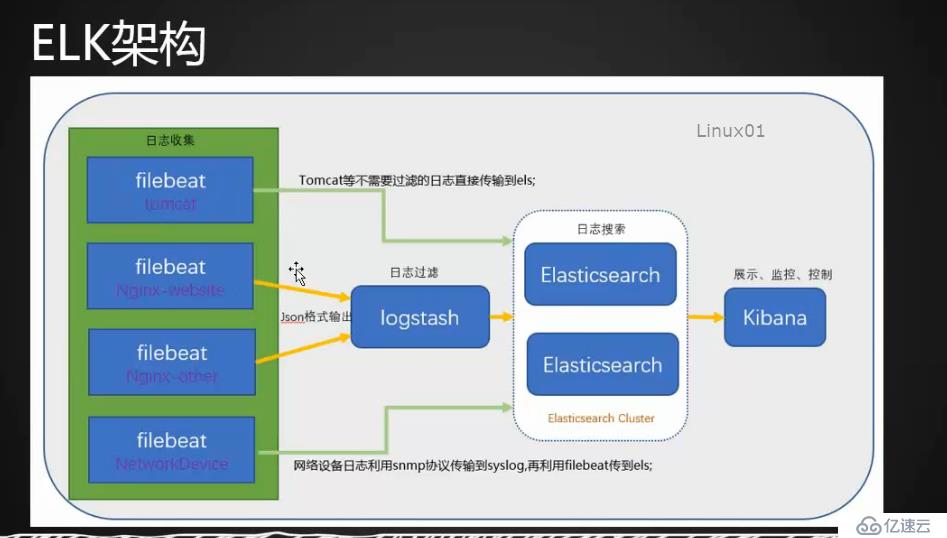
https://legacy.gitbook.com/book/chenryn/elk-stack-guide-cn/detailsELK Stack(5.0版本后)-->Elastic Stack相当于ELK Stack+Beats
ELK Stack包含:Elaticsearch、Logstash、Kibana
Elasticsearch是实时全文搜索和分析引擎,提供搜集、分析、存储数据三大功能;是一套REST和JAVA API开放且提供高效搜索功能,可扩展的分布式系统。它构建于Apache Lucene搜索引擎库之上。
Logstash用来采集(它支持几乎任何类型的日志,包括系统日志、错误日志和自定义应用程序日志)日志,把日志解析为json格式交给ElasticSearch
Kibana是一个基于Web图形界面,用于搜索、分析和可视化显示存储在 Elasticsearch指标中的日志数据。它利用Elasticsearch的REST接口来检索数据,不仅允许用户创建他们自己的数据的定制仪表板视图,还允许他们以特殊的方式查询和过滤数据
Beats是一个轻量级日志采集器,在早期的ELK架构中使用Logstash收集、解析日志,但是Logstash对内存、CPU、IO等资源消耗比较高,和Beates相比,Beates占用系统CPU、内存基本上可以忽略不计
1.配置节点互相解析
[root@node-11 ~]# cat /etc/hosts
127.0.0.1   localhost localhost.localdomain localhost4 localhost4.localdomain4
::1         localhost localhost.localdomain localhost6 localhost6.localdomain6
10.71.11.1  node-1
10.71.11.2  node-2
10.71.11.11 node-11
2.每个节点安装jdk
[root@node-11 ~]# yum install -y java-1.8.0-openjdk查看jdk版本
[root@node-1 ~]# java -version
java version "1.8.0_161"
Java(TM) SE Runtime Environment (build 1.8.0_161-b12)
Java HotSpot(TM) 64-Bit Server VM (build 25.161-b12, mixed mode)
特别说明:目前logstash不支持java9
注:三个节点都执行以下命令
导入key
rpm --import https://artifacts.elastic.co/GPG-KEY-elasticsearch配置yum源
[root@node-1 ~]#  vi /etc/yum.repos.d/elastic.repo
[elasticsearch-6.x]
name=Elasticsearch repository for 6.x packages
baseurl=https://artifacts.elastic.co/packages/6.x/yum
gpgcheck=1
gpgkey=https://artitacts.elastic.co/GPG-KEY-elasticsearch
enabled=1
autorefresh=1
type=rpm-md
更新缓存
yum makecache考虑到软件包下载速度较慢,采用rpm包安装elasticsearch
rpm下载地址:
https://www.elastic.co/downloads/elasticsearch把下载的rpm包上传到节点且安装
rpm -ivh elasticsearch-6.2.3.rpm编辑/etc/elasticsearch/elasticsearch.yml,增加或者修改以下参数
##定义elk集群名字、节点名字
cluster.name: cluster_elk
node.name: node-1
node.master: true
node.data: false

#定义主机名IP和端口
network.host: 10.71.11.1
http.port: 9200

##定义集群节点
discovery.zen.ping.unicast.hosts: ["node-1","node-2","node-11"]
把node-1上的配置文件/etc/elasticsearch/elasticsearch.yml拷贝到node-2和node-11
[root@node-1 ~]# scp !$ node-2:/tmp/
scp /etc/elasticsearch/elasticsearch.yml node-2:/tmp/
elasticsearch.yml                                                                                                          100% 3001     3.6MB/s   00:00
[root@node-1 ~]# scp /etc/elasticsearch/elasticsearch.yml node-11:/tmp/
root@node-11's password:
elasticsearch.yml
[root@node-11 yum.repos.d]# cp /tmp/elasticsearch.yml /etc/elasticsearch/elasticsearch.yml
cp: overwrite ‘/etc/elasticsearch/elasticsearch.yml’? y
[root@node-11 yum.repos.d]# vim /etc/elasticsearch/elasticsearch.yml
在node-2上编辑/etc/elasticsearch/elasticsearch.yml
# ---------------------------------- Cluster -----------------------------------
#
# Use a descriptive name for your cluster:
#
#cluster.name: my-application
cluster.name: cluster_elk
# ------------------------------------ Node ------------------------------------
#
# Use a descriptive name for the node:
#
#node.name: node-1
node.name: node-2
node.master: false
node.data: true
# Add custom attributes to the node:
#
#node.attr.rack: r1
#
# ----------------------------------- Paths ------------------------------------
#
# Path to directory where to store the data (separate multiple locations by comma):
#
path.data: /var/lib/elasticsearch
#
# Path to log files:
#
path.logs: /var/log/elasticsearch
#
# ---------------------------------- Network -----------------------------------
#
# Set the bind address to a specific IP (IPv4 or IPv6):
#
network.host: 10.71.11.2
# Set a custom port for HTTP:
#
http.port: 9200
#
# For more information, consult the network module documentation.
#
# --------------------------------- Discovery ----------------------------------
#
# Pass an initial list of hosts to perform discovery when new node is started:
# The default list of hosts is ["127.0.0.1", "[::1]"]
#
#discovery.zen.ping.unicast.hosts: ["host1", "host2"]
**discovery.zen.ping.unicast.hosts: ["node-1","node-2","node-11"]**
# Prevent the "split brain" by configuring the majority of nodes (total number of master-eligible nodes / 2 + 1):
#
#discovery.zen.minimum_master_nodes:
#
# For more information, consult the zen discovery module documentation.
#
# ---------------------------------- Gateway -----------------------------------
同理修改node-11上的/etc/elasticsearch/elasticsearch.yml 配置文件
在node-1上启动elasticsearch
[root@node-1 ~]# systemctl start elasticsearch
[root@node-1 ~]# systemctl status  elasticsearch
● elasticsearch.service - Elasticsearch
   Loaded: loaded (/usr/lib/systemd/system/elasticsearch.service; enabled; vendor preset: disabled)
   Active: active (running) since Thu 2018-04-12 21:11:28 CST; 12s ago
     Docs: http://www.elastic.co
Main PID: 17297 (java)
    Tasks: 67
   Memory: 1.2G
   CGroup: /system.slice/elasticsearch.service
           └─17297 /bin/java -Xms1g -Xmx1g -XX:+UseConcMarkSweepGC -XX:CMSInitiatingOccupancyFraction=75 -XX:+UseCMSInitiatingOccupancyOnly -XX:+AlwaysPre...

Apr 12 21:11:28 node-1 systemd[1]: Started Elasticsearch.
Apr 12 21:11:28 node-1 systemd[1]: Starting Elasticsearch...
查看集群日志
[root@node-1 ~]# tail -f /var/log/elasticsearch/cluster_elk.log
[2018-04-12T21:11:34,704] [INFO ] [o.e.d.DiscoveryModule    ] [node-1] using discovery type [zen]
[2018-04-12T21:11:35,187] [INFO ] [o.e.n.Node               ]  [node-1] initialized
[2018-04-12T21:11:35,187] [INFO ] [o.e.n.Node               ] [node-1] starting ...
[2018-04-12T21:11:35,370] [INFO ] [o.e.t.TransportService   ] [node-1] publish_address {10.71.11.1:9300}, bound_addresses {10.71.11.1:9300}
[2018-04-12T21:11:35,380] [INFO ] [o.e.b.BootstrapChecks    ] [node-1] bound or publishing to a non-loopback address, enforcing bootstrap checks
[2018-04-12T21:11:38,423] [INFO ] [o.e.c.s.MasterService    ] [node-1] zen-disco-elected-as-master ([0] nodes joined), reason: new_master {node-1}{PVxBZmElTXOHkzavFVFEnA}{xsTmwB7MTwu-8cwwALyTPA}{10.71.11.1}{10.71.11.1:9300}
[2018-04-12T21:11:38,428] [INFO ] [o.e.c.s.ClusterApplierService] [node-1] new_master {node-1}{PVxBZmElTXOHkzavFVFEnA}{xsTmwB7MTwu-8cwwALyTPA}{10.71.11.1}{10.71.11.1:9300}, reason: apply cluster state (from master [master {node-1}{PVxBZmElTXOHkzavFVFEnA}{xsTmwB7MTwu-8cwwALyTPA}{10.71.11.1}{10.71.11.1:9300} committed version [1] source [zen-disco-elected-as-master ([0] nodes joined)]])
[2018-04-12T21:11:38,442] [INFO ] [o.e.h.n.Netty4HttpServerTransport] [node-1] publish_address {10.71.11.1:9200}, bound_addresses {10.71.11.1:9200}
[2018-04-12T21:11:38,442] [INFO ] [o.e.n.Node               ] [node-1] started
[2018-04-12T21:11:38,449] [INFO ] [o.e.g.GatewayService     ] [node-1] recovered [0] indices into cluster_state
在主节点查看集群健康状态
[root@node-1 ~]# curl '10.71.11.1:9200/_cluster/health?pretty'
{
  "cluster_name" : "cluster_elk",
  "status" : "green",
  "timed_out" : false,
  "number_of_nodes" : 1,
  "number_of_data_nodes" : 0,
  "active_primary_shards" : 0,
  "active_shards" : 0,
  "relocating_shards" : 0,
  "initializing_shards" : 0,
  "unassigned_shards" : 0,
  "delayed_unassigned_shards" : 0,
  "number_of_pending_tasks" : 0,
  "number_of_in_flight_fetch" : 0,
  "task_max_waiting_in_queue_millis" : 0,
  "active_shards_percent_as_number" : 100.0
}
在node-1点查看集群的详细信息
[root@node-1 ~]# curl '10.71.11.1:9200/_cluster/state?pretty'
{
  "cluster_name" : "cluster_elk",
  "compressed_size_in_bytes" : 226,
  "version" : 2,
  "state_uuid" : "-LLN7fEYQJiKZSLqitdOvQ",
  "master_node" : "PVxBZmElTXOHkzavFVFEnA",
  "blocks" : { },
  "nodes" : {
    "PVxBZmElTXOHkzavFVFEnA" : {
      "name" : "node-1",
      "ephemeral_id" : "xsTmwB7MTwu-8cwwALyTPA",
      "transport_address" : "10.71.11.1:9300",
      "attributes" : { }
    }
  },
  "metadata" : {
    "cluster_uuid" : "LaaRmRfRTfOY-ApuNz_nfA",
    "templates" : { },
    "indices" : { },
    "index-graveyard" : {
      "tombstones" : [ ]
    }
  },
  "routing_table" : {
    "indices" : { }
  },
  "routing_nodes" : {
    "unassigned" : [ ],
    "nodes" : { }
  },
  "snapshots" : {
    "snapshots" : [ ]
  },
  "restore" : {
    "snapshots" : [ ]
  },
  "snapshot_deletions" : {
    "snapshot_deletions" : [ ]
  }
}注:在node-1节点执行
yum install -y kibana
说明:使用yum安装速度相对较慢,所以使用rpm包安装
下载kibana-6.2.3-x86_64 .rpm并上传到node-1节点安装kibana
https://www.elastic.co/downloads/kibana[root@node-1 ~]# rpm -ivh kibana-6.2.3-x86_64.rpm
Preparing... ################################# [100%]
package kibana-6.2.3-1.x86_64 is already installed编辑/etc/kibana/kibana.yml
server.port :    5601   ##配置监听端口,默认监听5601端口

server.host: "10.71.11.1"    ##配置服务主机名或者IP,需要注意的是,如果没有安装x-pack组件,就不能设置kibana登录用户和密码,而这里的IP又是配置公网IP的话,任何人都能登录kibana,如果这里配置的IP为内网IP和port,要保证能从公网能登录kibana的话,可以使用nginxu做代理实现

elasticsearch.url: "http://10.71.11.1:9200"      ##配置kibana和elasticsearch通信

logging.dest: /var/log/kibana.log    ##默认情况下,kibana的日志是在/var/log/message/下。也可以自定义kibana.log路径/var/log/kibana.log
启动kibana服务
[root@node-1 ~]# systemctl start kibana
[root@node-1 ~]# ps aux |grep kibana
kibana 650 109 0.0 944316 99684 ? Rsl 10:59 0:02 /usr/share/kibana/bin/../node/bin/node --no-warnings /usr/share/kibana/bin/../src/cli -c /etc/kibana/kibana.yml
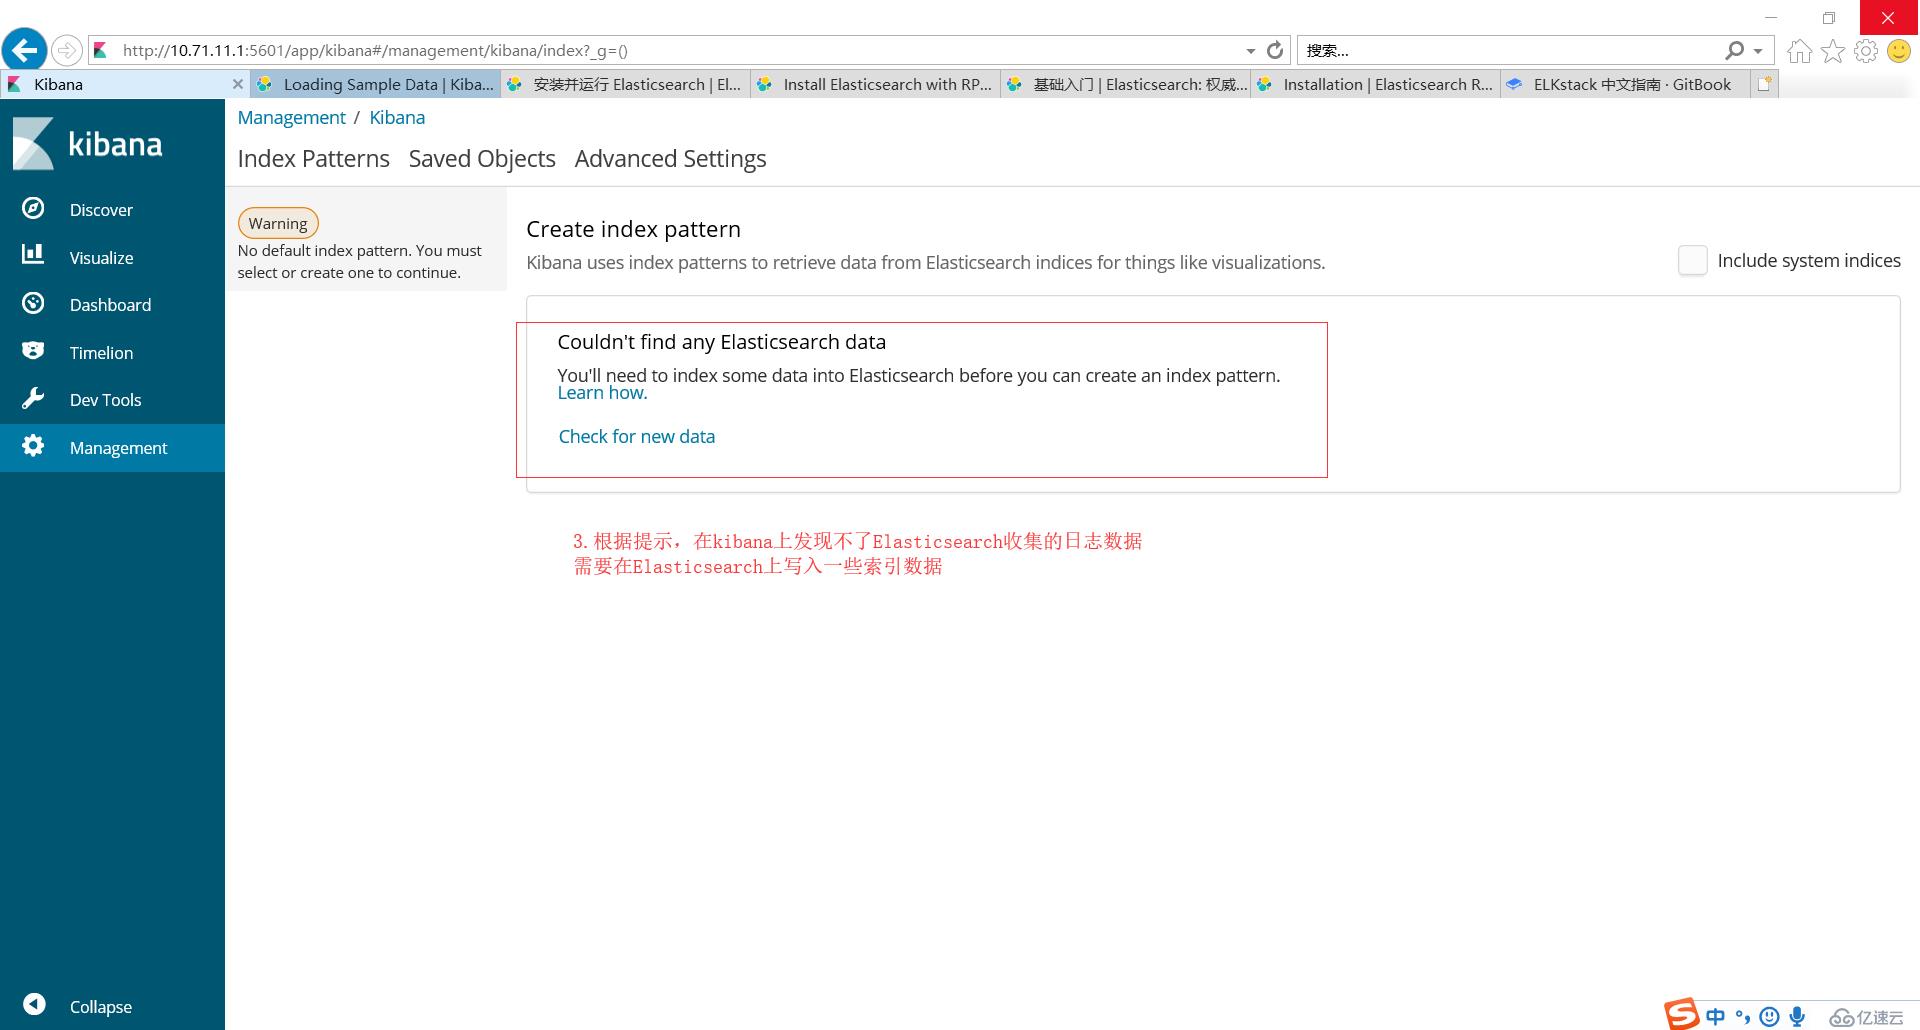
root 659 0.0 0.0 112660 976 pts/6 S+ 10:59 0:00 grep --color=auto kib在浏览器上访问Kibana:http://10.71.11.1:5601/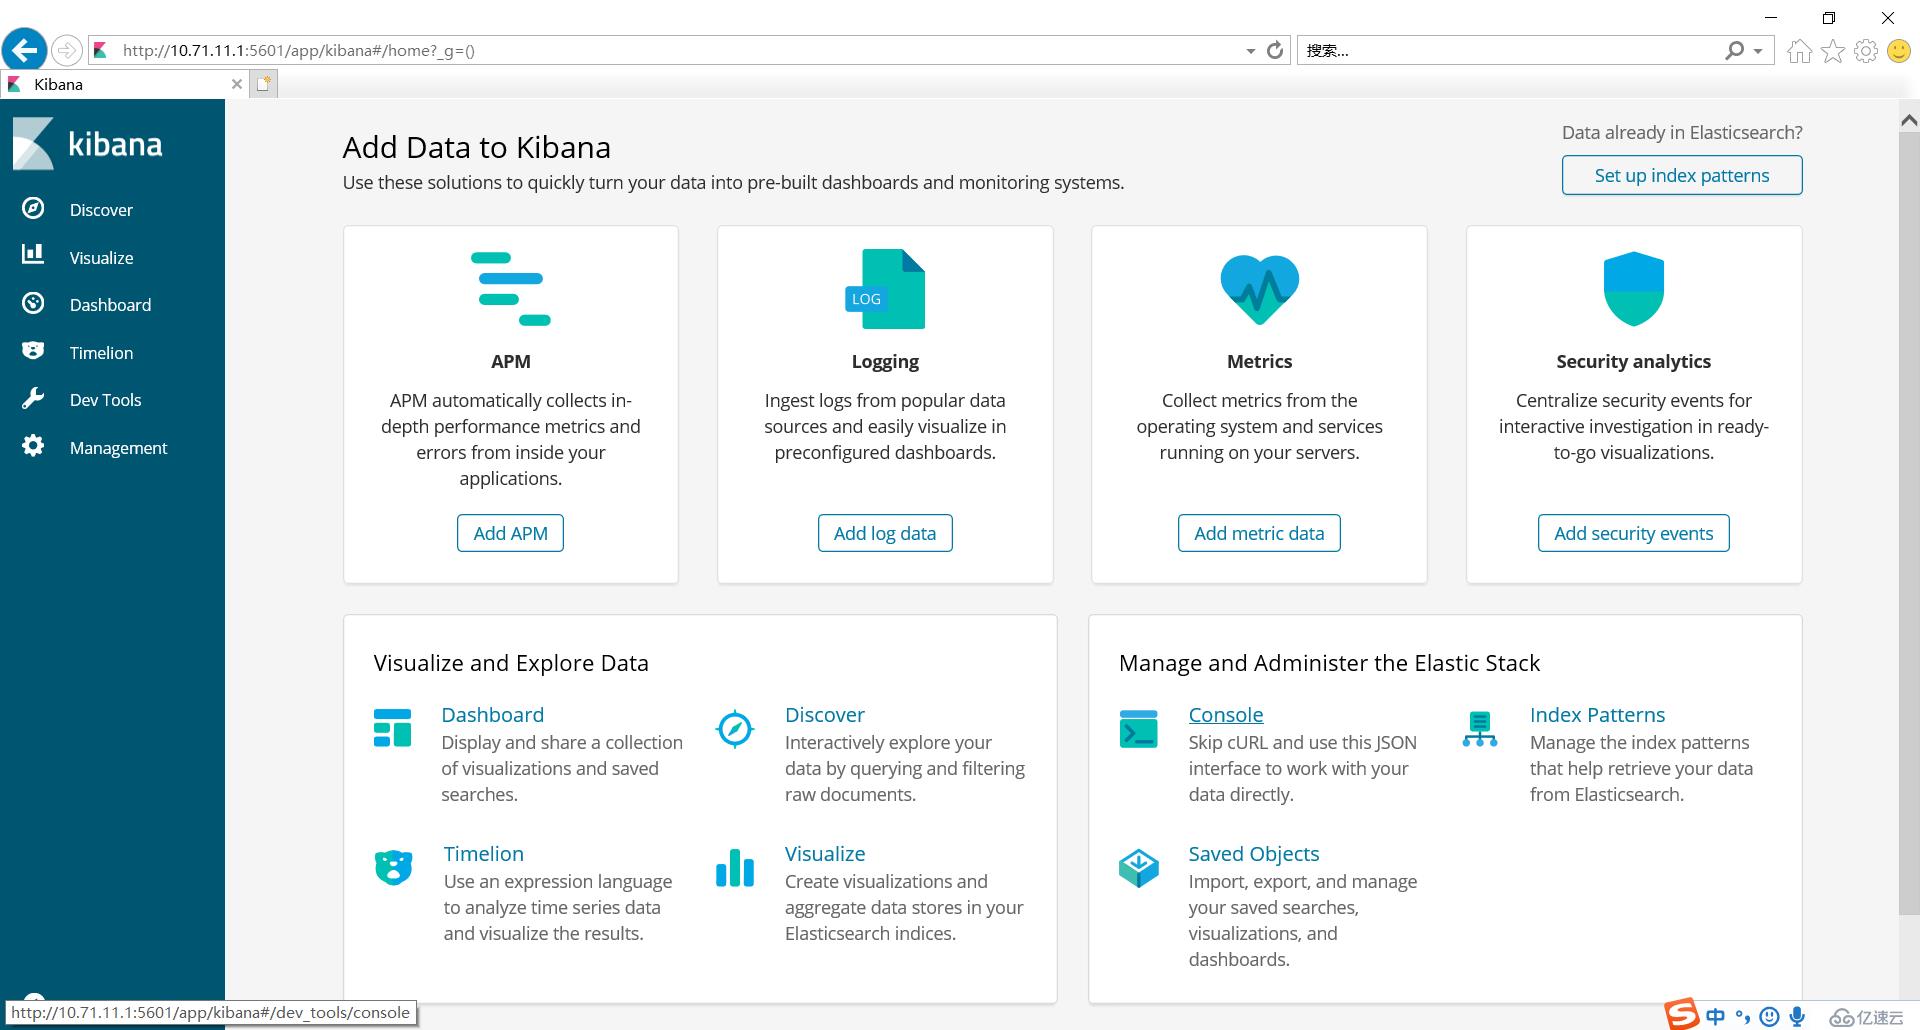
注:无特使说明,以下操作在node-2上完成
下载logstash-6.2.3 .rpm并上传到node-2
https://www.elastic.co/downloads/logstash安装logstash服务
[root@node-2 ~]# ls logstash-6.2.3.rpm
logstash-6.2.3.rpm
[root@node-2 ~]# rpm -ivh logstash-6.2.3.rpm
Preparing...                          ################################# [100%]
Updating / installing...
   1:logstash-1:6.2.3-1               ################################# [100%]
Using provided startup.options file: /etc/logstash/startup.options
Successfully created system startup script for Logstash编辑/etc/logstash/conf.d/syslog.conf
input{
syslog{
type =>"system-syslog"
port => 10514
}
}
output{
stdout{
codec=>rubydebug
}
}检测配置文件语法错误
[root@node-2 ~]# cd /usr/share/logstash/bin/
[root@node-2 bin]#  ./logstash --path.settings /etc/logstash/ -f /etc/logstash/conf.d/syslog.conf --config.test_and_exit
 Sending Logstash's  logs to /var/log/logstash which is now configured via log4j2.properties
Configuration OK
参数说明:
--path.settings /etc/logstash/ 指定logstash配置文件路径
-f 指定自定义的配置文件
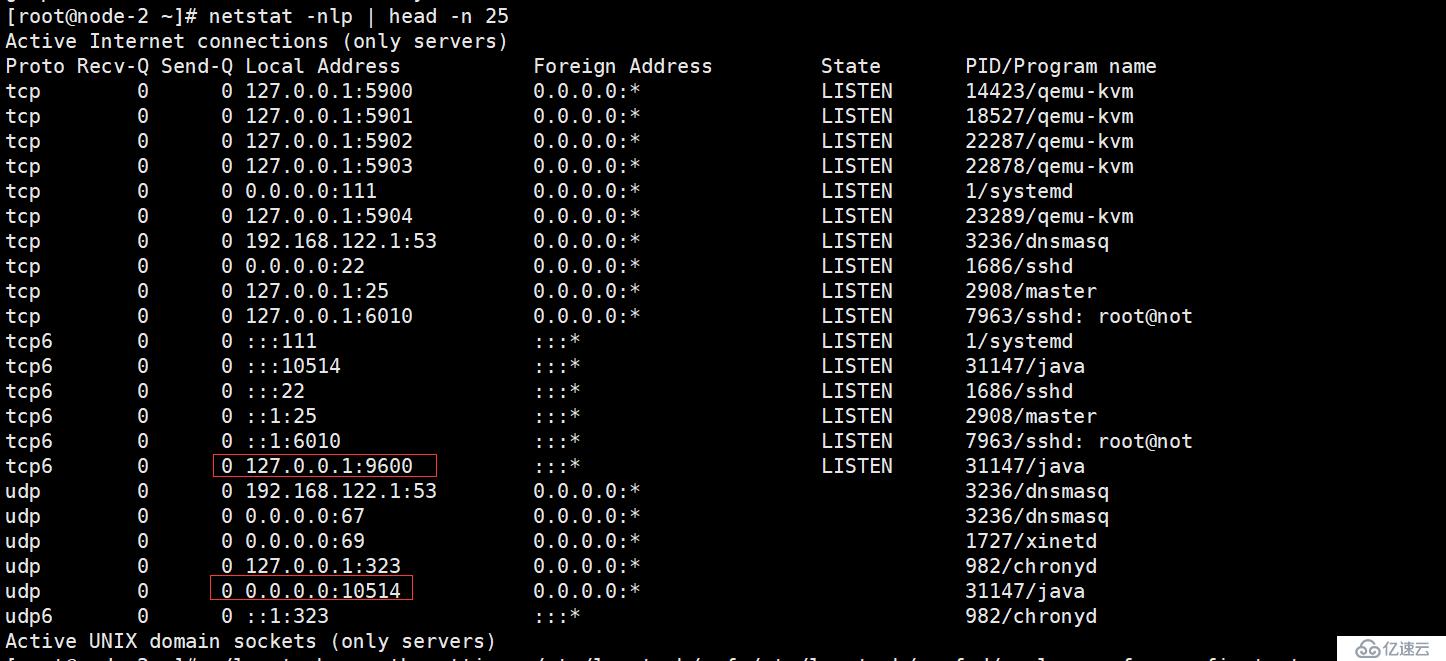
检查是否开启10514监听端口
编辑/etc/rsyslog.conf,在####RULES####添加下面的配置
[root@node-2 ~]# vi /etc/rsyslog.conf
*.*  @@10.71.11.2:10514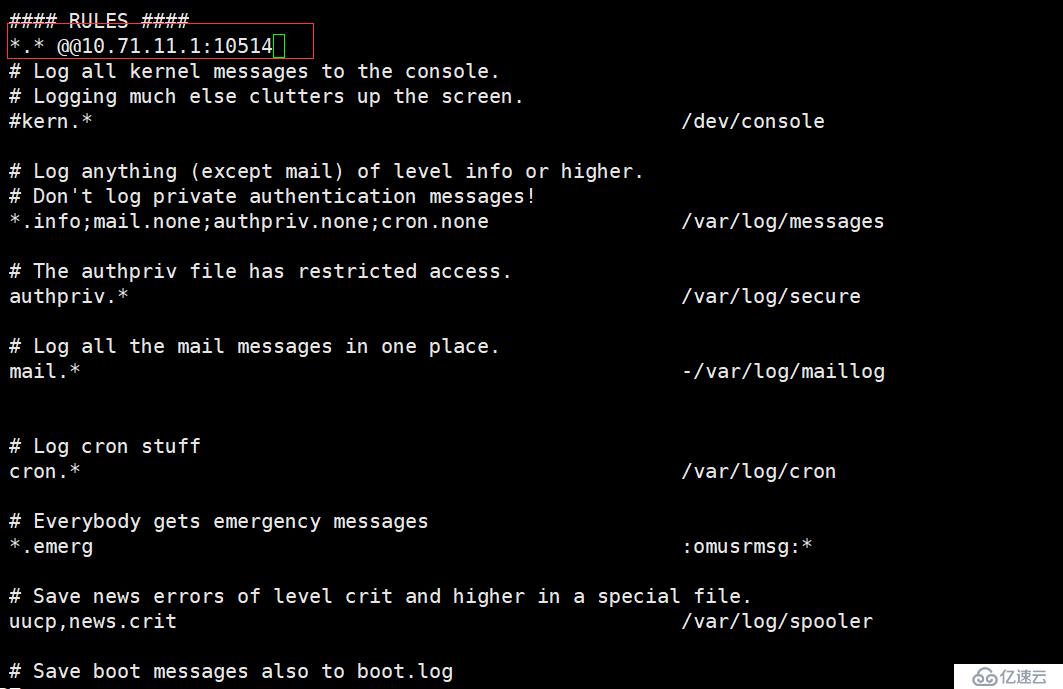
执行logstash启动命令后,命令行终端不会返回数据,这个和配置etc/logstash/conf.d/syslog.conf定义的函数有关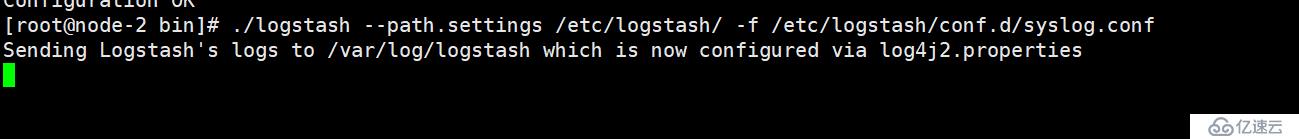
此时需要重新复制node-2的ssh终端,在新的ssh终端重启rsyslog.service
[root@node-2 ~]# systemctl restart rsyslog.service在新的ssh终端执行ssh node-2命令后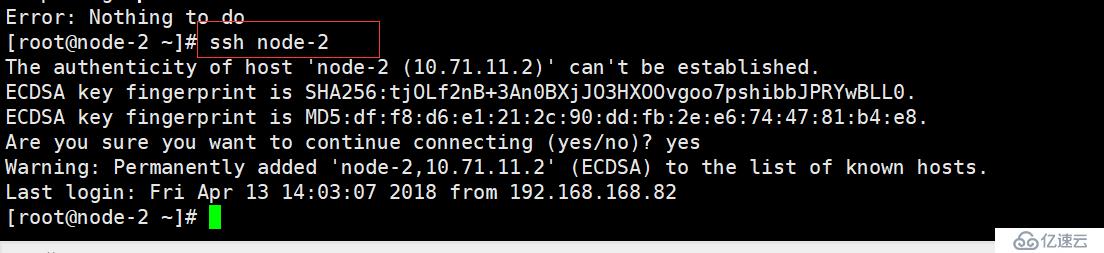
在另外一个node-2的ssh终端会看到有日志信息输出,说明配置logstash收集系统日志成功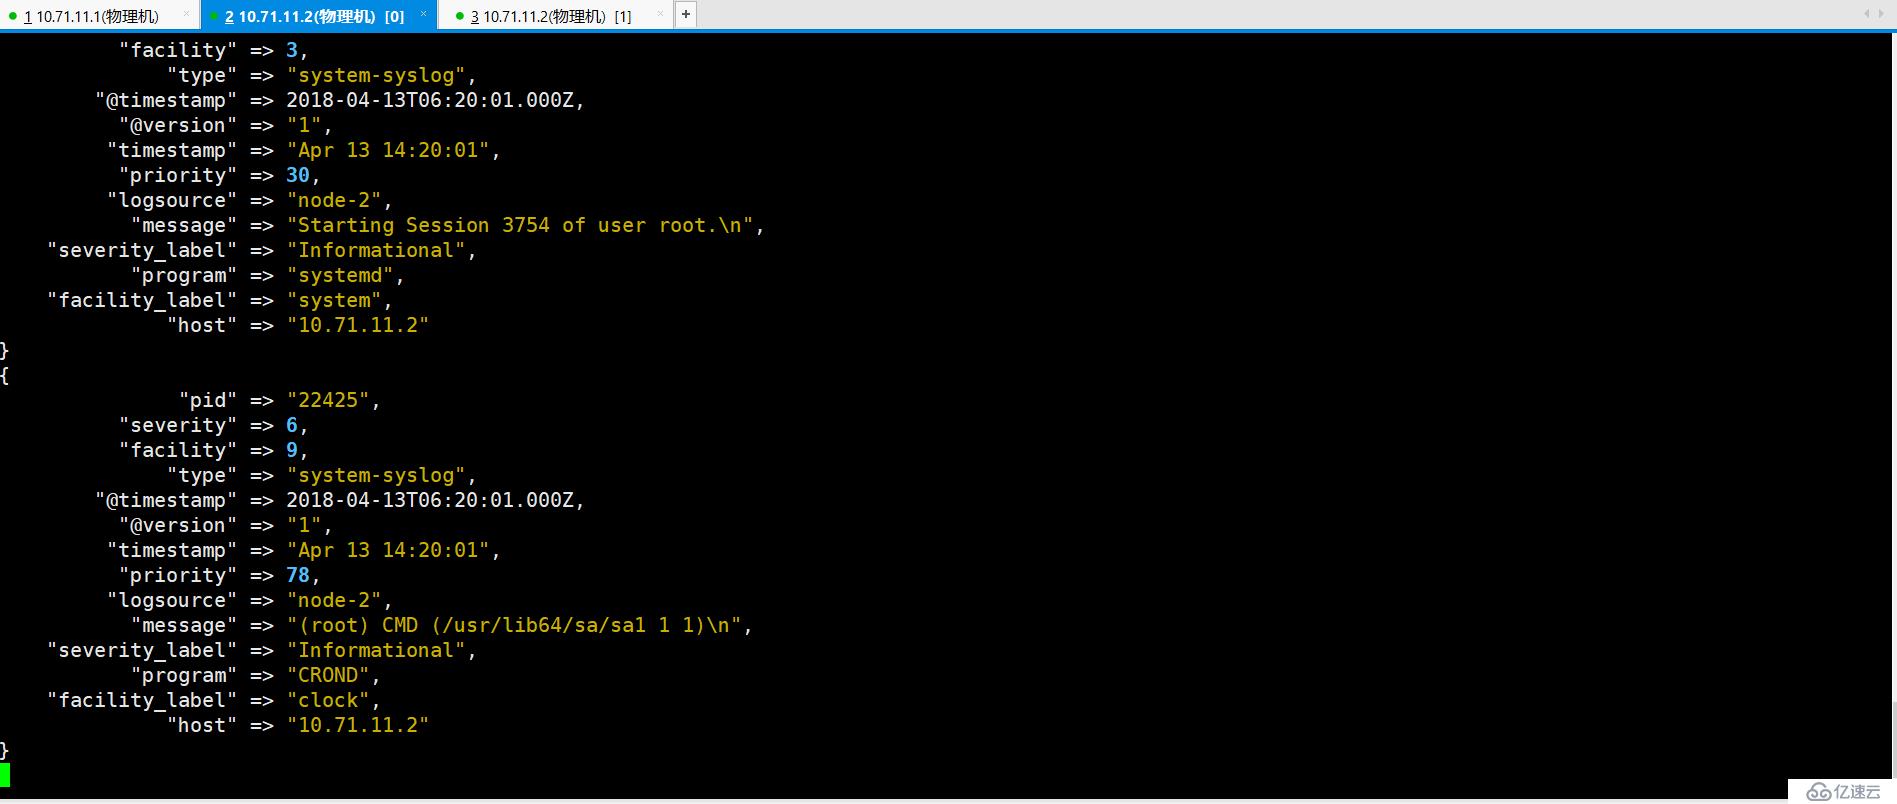
以下操作在node-2执行
编辑/etc/logstash/conf.d/syslog.conf
input{
      syslog{
             type =>"system-syslog"
             port => 10514
  }
}
output{
      elasticsearch {
                             hosts => ["10.71.11.1:9200"]
                             index => "system-syslog-%{+YYY.MM}"  ##定义索引
  }
}
验证配置文件语法是否错误
[root@node-2 ~]# ./logstash --path.settings /etc/logstash/ -f /etc/logstash/conf.d/syslog.conf --config.test_and_exit修改logstash目录权限属主和属组
[root@node-2 bin]# chown -R logstash /var/lib/logstash因为logstash服务过程需要一些时间,当服务启动成功后,9600和10514端口都会被监听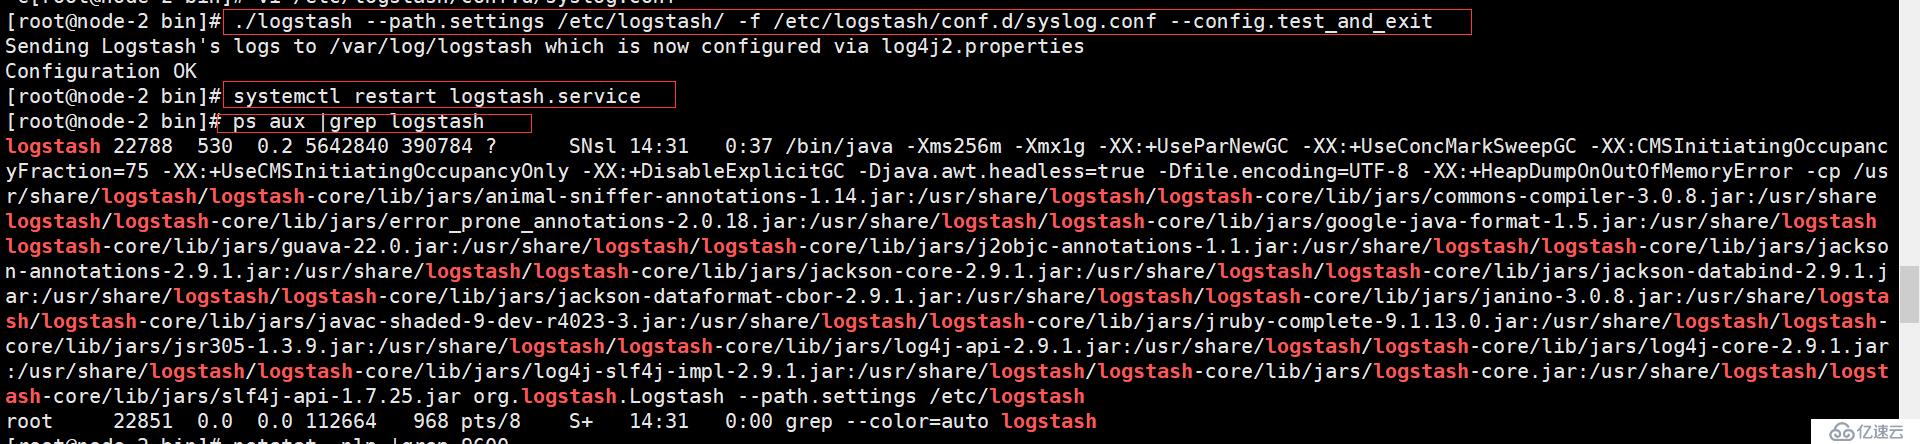
说明:logstash服务日志路径
/var/log/logstash/logstash-plain.log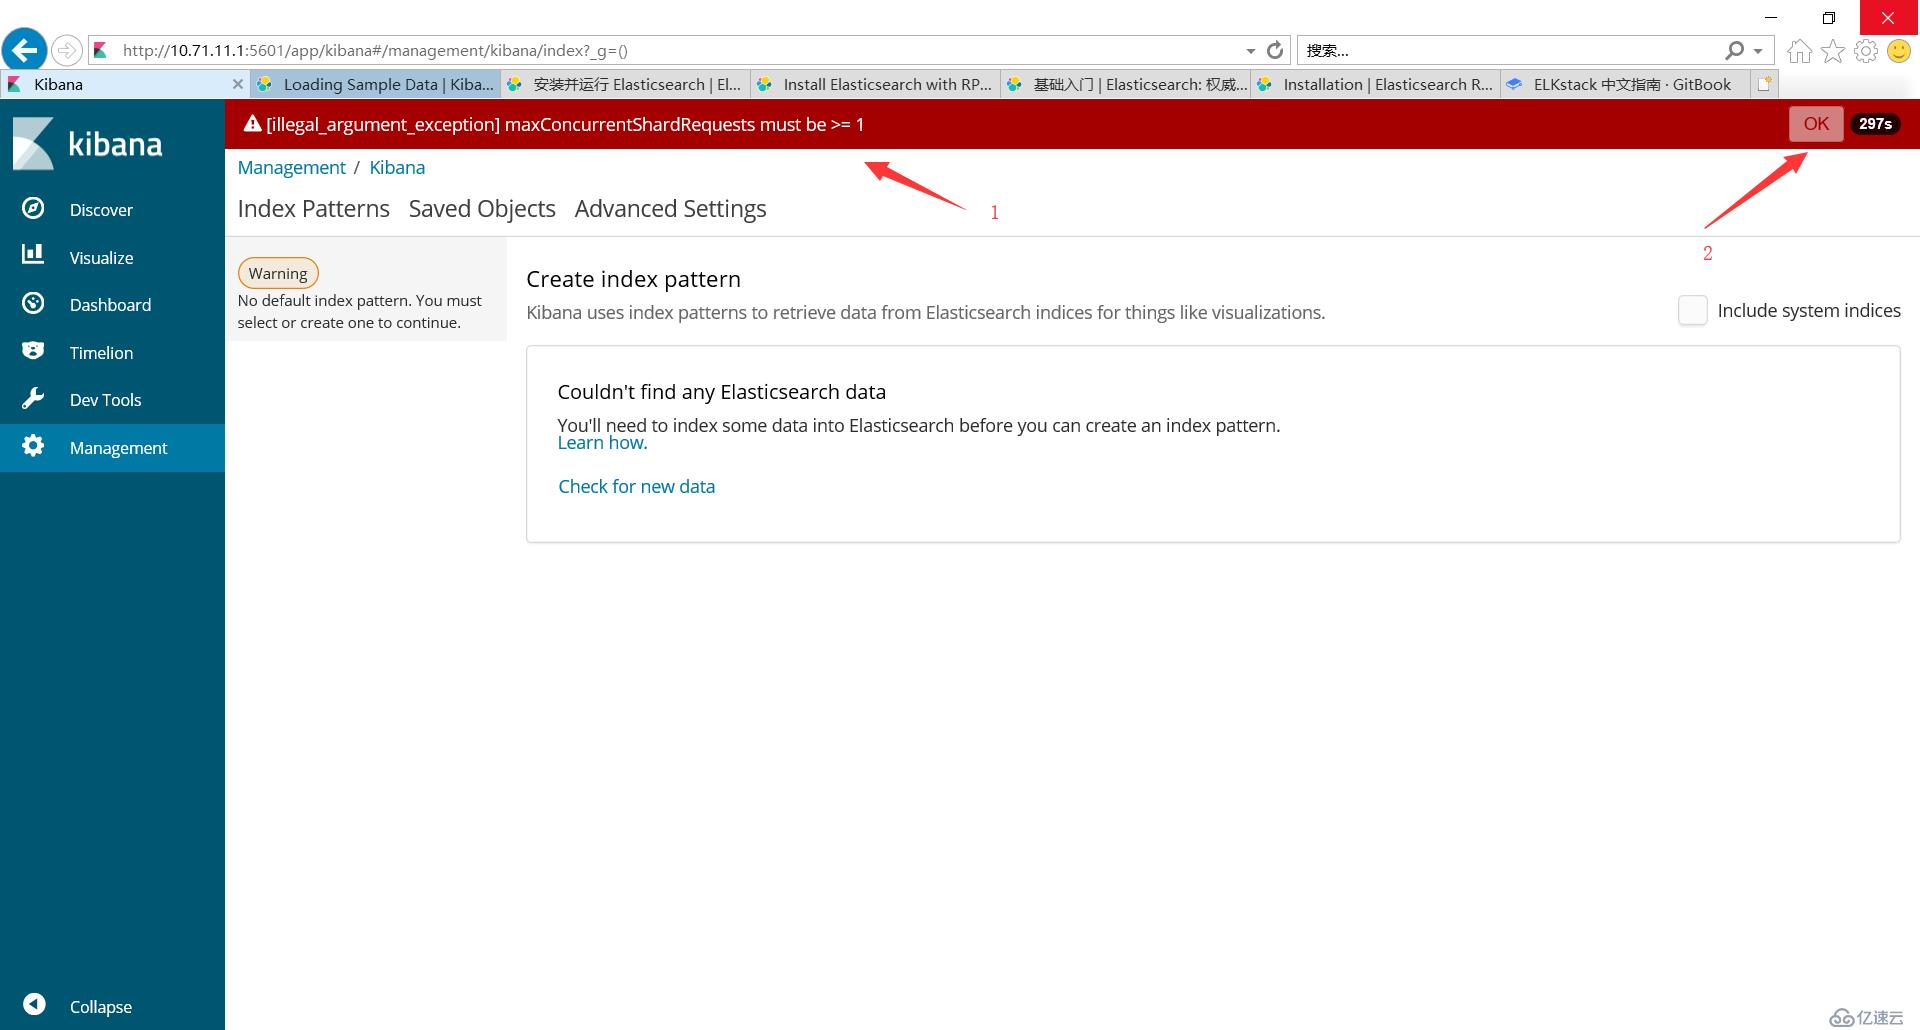
先在elasticsearch上查看数据索引
编辑node-2上的/etc/logstash/logstash.yml,添加
http.host: "10.71.11.2"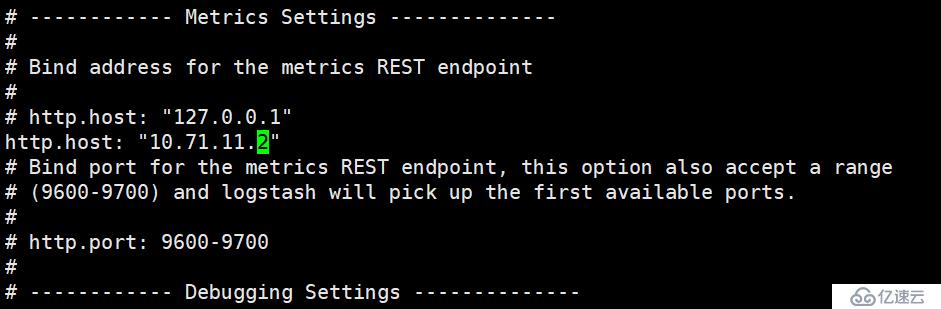
在node-1上执行下面命令获取索引信息
[root@node-1 ~]# curl '10.71.11.1:9200/_cat/indices?v'
health status index                 uuid                   pri rep docs.count docs.deleted store.size pri.store.size
yellow open   system-syslog-2018.04 3Za0b5rBTYafhsxQ-A1P-g   5   1
说明:成功生成索引,说明es和logstash通信正常
获取索引的详细信息
[root@node-1 ~]# curl '10.71.11.1:9200/indexname?pretty'
{
  "error" : {
    "root_cause" : [
      {
        "type" : "index_not_found_exception",
        "reason" : "no such index",
        "resource.type" : "index_or_alias",
        "resource.id" : "indexname",
        "index_uuid" : "_na_",
        "index" : "indexname"
      }
    ],
    "type" : "index_not_found_exception",
    "reason" : "no such index",
    "resource.type" : "index_or_alias",
    "resource.id" : "indexname",
    "index_uuid" : "_na_",
    "index" : "indexname"
  },
  "status" : 404
}免责声明:本站发布的内容(图片、视频和文字)以原创、转载和分享为主,文章观点不代表本网站立场,如果涉及侵权请联系站长邮箱:is@yisu.com进行举报,并提供相关证据,一经查实,将立刻删除涉嫌侵权内容。