您好,登录后才能下订单哦!
密码登录
登录注册
点击 登录注册 即表示同意《亿速云用户服务条款》
这篇文章主要讲解了“Java在PPT中创建散点图的实现方法是什么”,文中的讲解内容简单清晰,易于学习与理解,下面请大家跟着小编的思路慢慢深入,一起来研究和学习“Java在PPT中创建散点图的实现方法是什么”吧!
需要在Java程序中导入用于操作PPT的jar包 Free Spire.Presentation for Java。可参考如下两种方法导入:
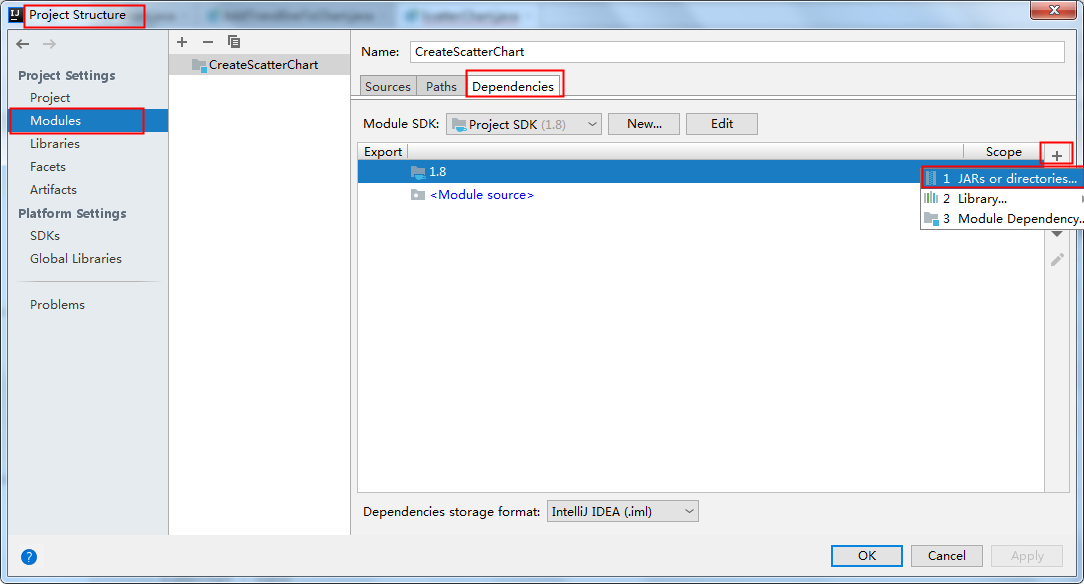
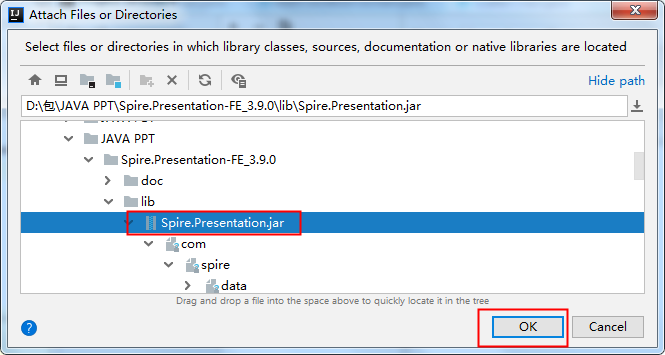
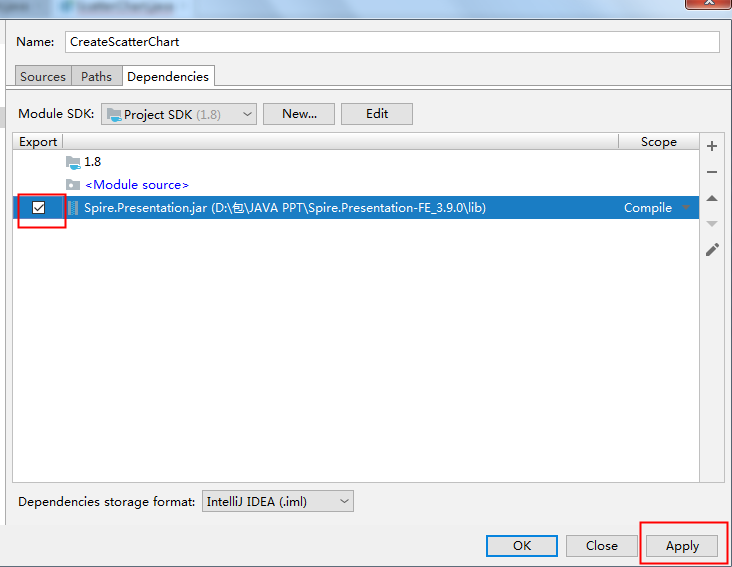
方法1:手动导入jar包。需下载jar包到本地,并解压,找到lib文件夹下的jar文件。然后按照如下步骤执行,导入:
方法2:maven仓库下载导入。需在pom.xml文件中配置maven仓库路径,并指定依赖。配置内容如下:
<repositories>
        <repository>
            <id>com.e-iceblue</id>
            <url>https://repo.e-iceblue.cn/repository/maven-public/</url>
        </repository>
    </repositories>
<dependencies>
    <dependency>
        <groupId> e-iceblue </groupId>
        <artifactId>spire.presentation.free</artifactId>
        <version>3.9.0</version>
    </dependency>
</dependencies>
通过指定数据源,并在幻灯片中的指定坐标位置插入图表。该Jar包提供了ShapeCollection.appendChart(ChartType type, Rectangle2D rectangle, boolean init)方法向幻灯片添加特定类型的图表,ChartType枚举预定义了73种图表类型,包括但不限于散点图、柱图、饼图等。
本次创建散点图,主要通过以下步骤完成:
创建 Presentation 类的实例。
使用 ShapeCollection.appendChart() 方法将散点图附加到特定的幻灯片。
通过 ChartData.get().setValue() 方法设置图表数据。
使用 IChart 接口提供的方法设置图表标题、坐标轴标题、系列标签等。
设置网格线样式和数据点线样式。
使用 Presentation.saveToFile() 方法将文档保存到指定路径。
Java代码示例
import com.spire.presentation.FileFormat;
import com.spire.presentation.Presentation;
import com.spire.presentation.SlideSizeType;
import com.spire.presentation.TextLineStyle;
import com.spire.presentation.charts.ChartType;
import com.spire.presentation.charts.IChart;
import com.spire.presentation.charts.entity.ChartDataLabel;
import com.spire.presentation.drawing.FillFormatType;

import java.awt.*;
import java.awt.geom.Rectangle2D;

public class ScatterChart {
    public static void main(String[] args) throws Exception{
        //创建Presentation类的实例
        Presentation presentation = new Presentation();
        presentation.getSlideSize().setType(SlideSizeType.SCREEN_16_X_9);

        //添加散点图表到第一张幻灯片
        IChart chart = presentation.getSlides().get(0).getShapes().appendChart(ChartType.SCATTER_MARKERS,new Rectangle2D.Float(180, 80, 550, 320),false);

        //设置图表标题
        chart.getChartTitle().getTextProperties().setText("散点图表");
        chart.getChartTitle().getTextProperties().isCentered(true);
        chart.getChartTitle().setHeight(20f);
        chart.hasTitle(true);

        //设置图表数据源
        Double[] xData = new Double[] { 1.0, 2.4, 5.0, 8.9 };
        Double[] yData = new Double[] { 5.3, 15.2, 6.7, 8.0 };
        chart.getChartData().get(0,0).setText("X-值");
        chart.getChartData().get(0,1).setText("Y-值");
        for (int i = 0; i < xData.length; i++) {
            chart.getChartData().get(i+1,0).setValue(xData[i]);
            chart.getChartData().get(i+1,1).setValue(yData[i]);
        }

        //设置系列标签
        chart.getSeries().setSeriesLabel(chart.getChartData().get("B1","B1"));

        //设置X和Y轴值
        chart.getSeries().get(0).setXValues(chart.getChartData().get("A2","A5"));
        chart.getSeries().get(0).setYValues(chart.getChartData().get("B2","B5"));

        //添加数据标签
        for (int i = 0; i < 4; i++)
        {
            ChartDataLabel dataLabel = chart.getSeries().get(0).getDataLabels().add();
            dataLabel.setLabelValueVisible(true);
        }

        //设置主轴标题和次轴标题
        chart.getPrimaryValueAxis().hasTitle(true);
        chart.getPrimaryValueAxis().getTitle().getTextProperties().setText("X-轴 标题");
        chart.getSecondaryValueAxis().hasTitle(true);
        chart.getSecondaryValueAxis().getTitle().getTextProperties().setText("Y-轴 标题");

        //设置网格线
        chart.getSecondaryValueAxis().getMajorGridTextLines().setFillType(FillFormatType.SOLID);
        chart.getSecondaryValueAxis().getMajorGridTextLines().setStyle(TextLineStyle.THIN_THIN);
        chart.getSecondaryValueAxis().getMajorGridTextLines().getSolidFillColor().setColor(Color.GRAY);
        chart.getPrimaryValueAxis().getMajorGridTextLines().setFillType(FillFormatType.NONE);

        //设置数据点线
        chart.getSeries().get(0).getLine().setFillType(FillFormatType.SOLID);
        chart.getSeries().get(0).getLine().setWidth(0.1f);
        chart.getSeries().get(0).getLine().getSolidFillColor().setColor(Color.BLUE);

        //保存文档
        presentation.saveToFile("ScatterChart.pptx", FileFormat.PPTX_2013);
        presentation.dispose();
    }
}
图表效果图:
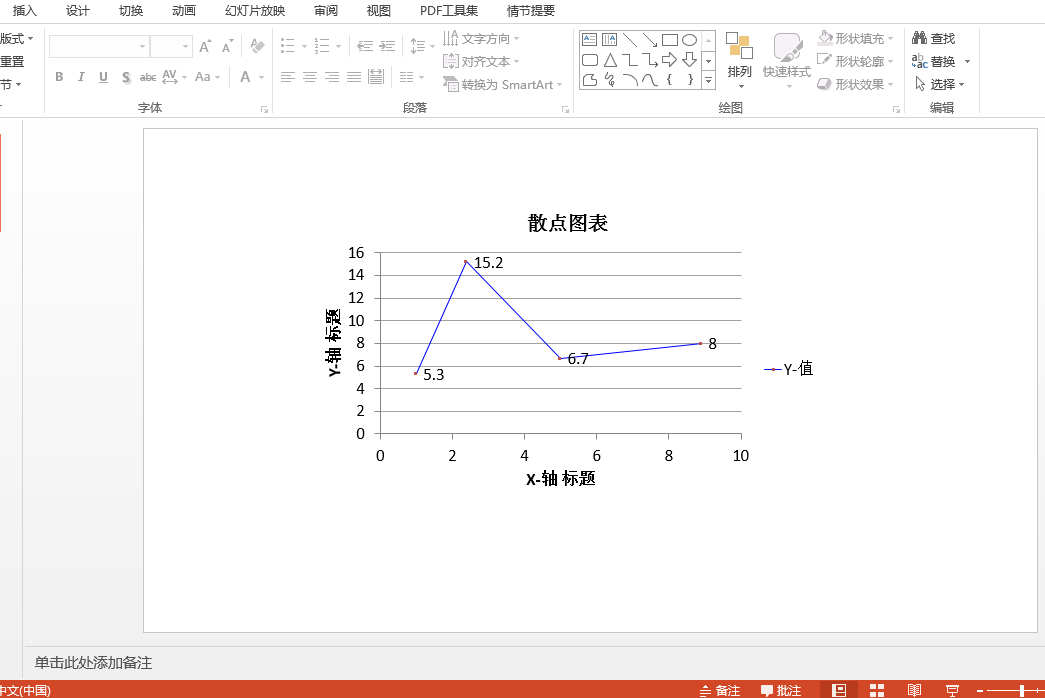
感谢各位的阅读,以上就是“Java在PPT中创建散点图的实现方法是什么”的内容了,经过本文的学习后,相信大家对Java在PPT中创建散点图的实现方法是什么这一问题有了更深刻的体会,具体使用情况还需要大家实践验证。这里是亿速云,小编将为大家推送更多相关知识点的文章,欢迎关注!
免责声明:本站发布的内容(图片、视频和文字)以原创、转载和分享为主,文章观点不代表本网站立场,如果涉及侵权请联系站长邮箱:is@yisu.com进行举报,并提供相关证据,一经查实,将立刻删除涉嫌侵权内容。