您好,登录后才能下订单哦!
密码登录
登录注册
点击 登录注册 即表示同意《亿速云用户服务条款》
一、简介
1、获取更多的NSClient原理,请参考NSClient++官方站点
NSClient++官网:http://www.nsclient.org/
2、NSClient++与NRPE
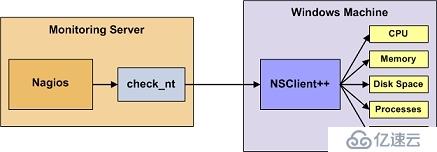
NSClient++的工作原理
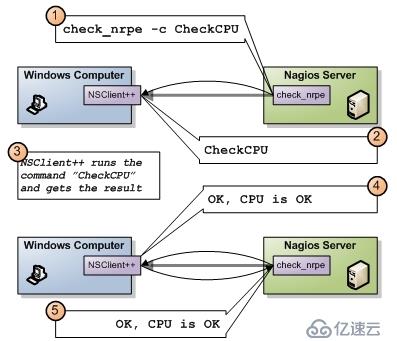
NRPE的工作原理
Nagios对Windows主机的监控主要有三种方法
第一种是NSclient++
第二种是NRPE
第三种是SNMP(不是很常用)
NSclient++与nrpe最大的区别就是:
1、被监控机上安装有nrpe,并且还有插件,最终的监控是由这些插件来进行的.当监控主机将监控请求发给nrpe后,nrpe调用插件来完成监控.
2、NSclient++则不同,被监控机上只安装NSclient++,没有任何的插件.当监控主机将监控请求发给NSclient++后,NSclient++直接完成监控,所有的监控是由NSclient++完成的。
这也说明了NSclient++的一个很大的问题,不灵活,没有可扩展性.它只能完成自己本身包含的监控操作,不能由一些插件来扩展.好在NSclient++已经做的不错了,基本上可以完全满足我们的监控需要。
二、check_nt的方式监控windows主机
1、下载NSClient++
下载地址:http://sourceforge.net/projects/nscplus/files/nscplus/
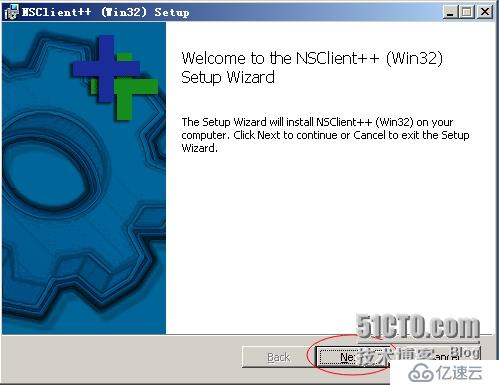
2、安装NSClient++

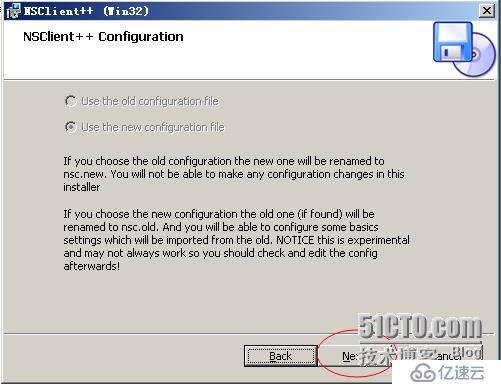
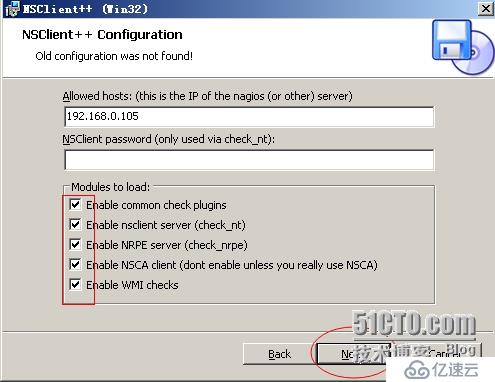
Allowed hosts:(this is the IP of the nagios (or other)server)
允许的主机地址:Nagios服务器端的IP地址
NSClient password(only userd via check_nt)
NSClient的密码:填写Nagios跟NSClient++进程通信的密码,可以不设置
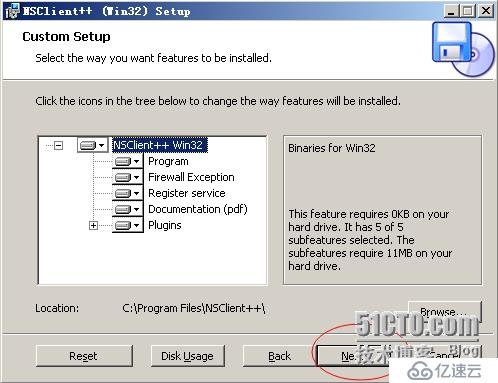
Modules to load:
安装并加载相应的模块:NSClient++自带的有check_plugins插件,check_nt,check_nrpe,NSCA,WMI
在这里我们全部选择,以后会有用到的。
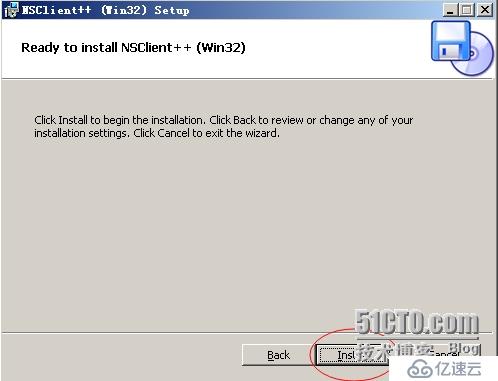
点击【Finsh】,表示安装NSClient++完成
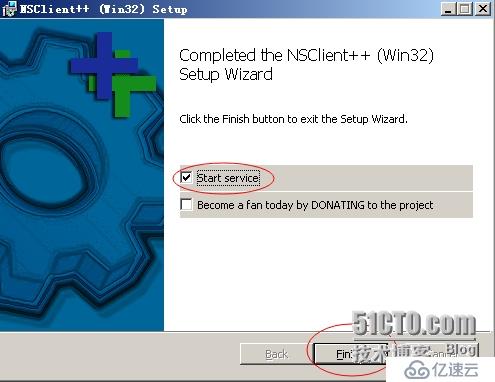
3、查看NSClient++服务是否已经启用
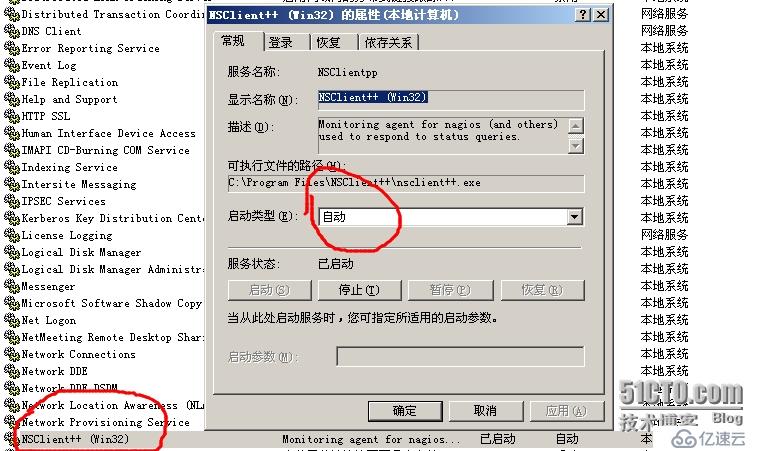

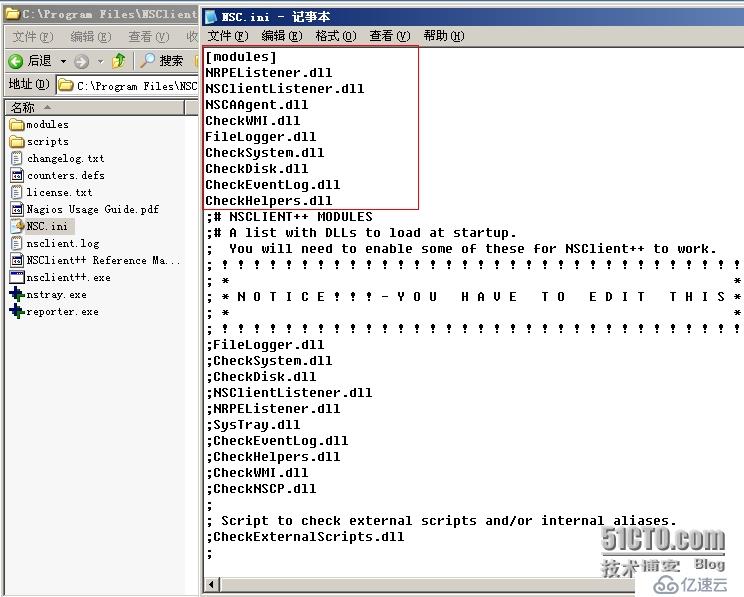
4、查看NSClient++的配置文件
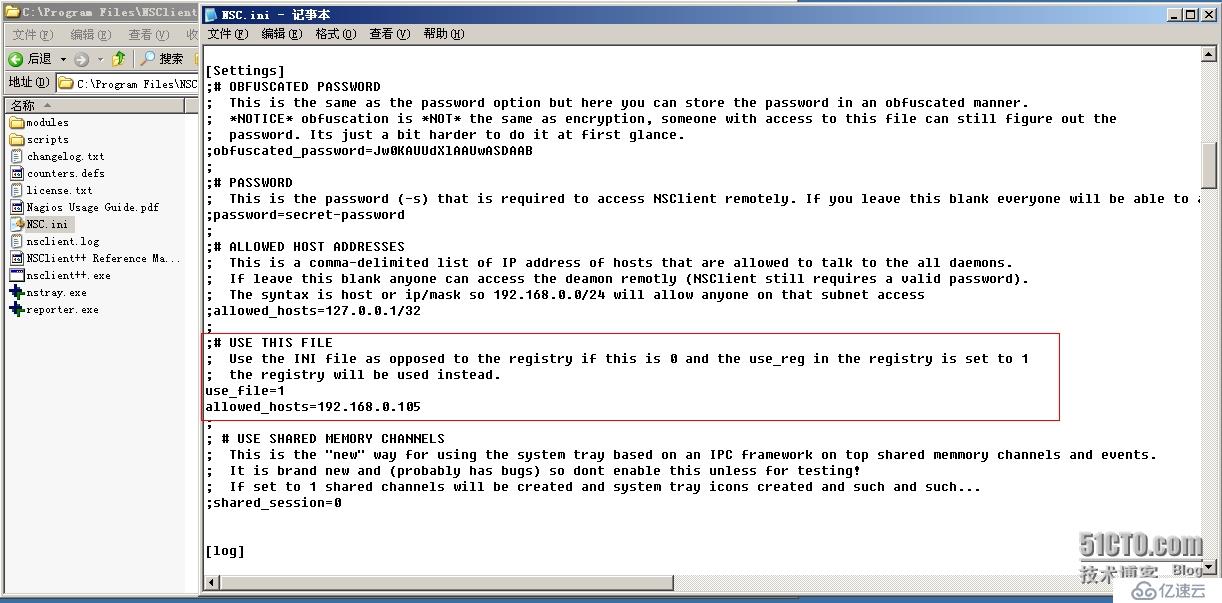
默认是安装在C:\Program Files\NSClient++ 目录下,NSC.ini即为NSClient服务的配置文件,一般我们无需修改,但是当我们监控端的IP地址改变时,或者密码忘记,即可以在这里修改了。
安装时加载的模块
设置允许连接的地址:为Nagios的IP地址
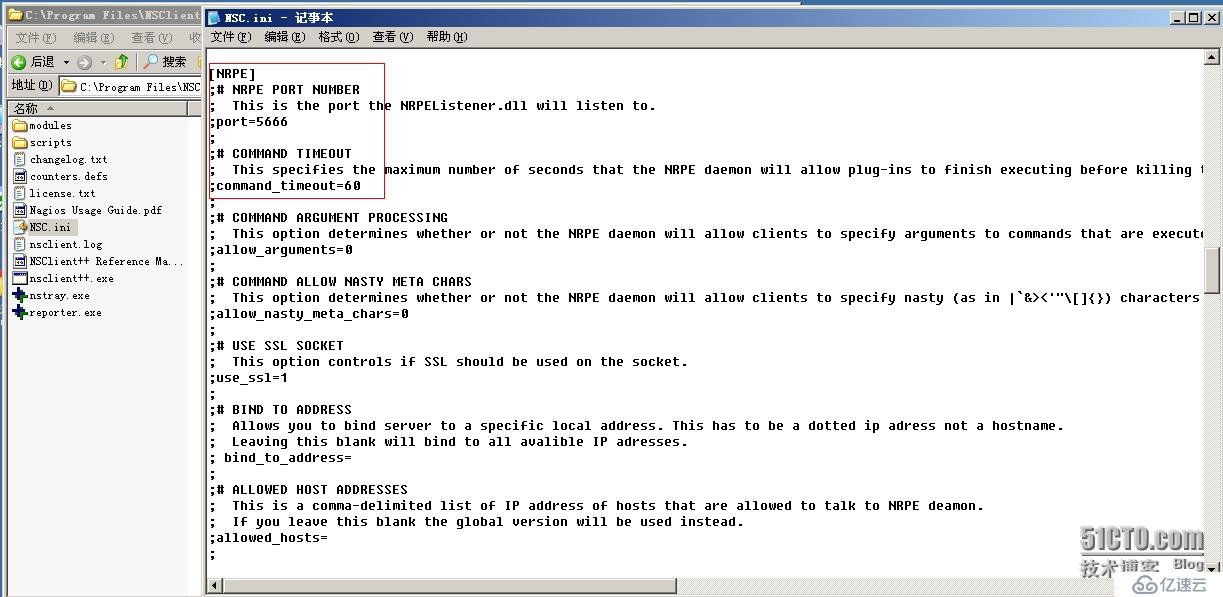
NRPE的默认端口号
三、NSClient应用监控
NSClient++与Nagios服务器通信,主要使用Nagios服务器的check_nt插件。原理图如下
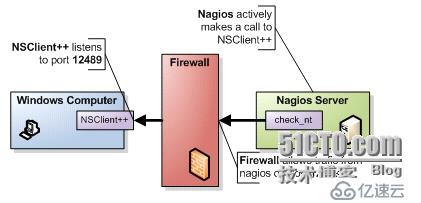
1、check_nt插件的使用说明
[root@Nagios ~]# cd /usr/local/nagios/libexec/
[root@Nagios libexec]# ./check_nt -h   #查看check_nt的语法
check_nt v2.0.3 (nagios-plugins 2.0.3)
Copyright (c) 2000 Yves Rubin (rubiyz@yahoo.com)
Copyright (c) 2000-2014 Nagios Plugin Development Team
	<devel@nagios-plugins.org>

This plugin collects data from the NSClient service running on a
Windows NT/2000/XP/2003 server.


Usage:
check_nt -H host -v variable [-p port] [-w warning] [-c critical]
[-l params] [-d SHOWALL] [-u] [-t timeout]

Options:
 -h, --help
    Print detailed help screen
 -V, --version
    Print version information
 --extra-opts=[section][@file]
    Read options from an ini file. See
    https://www.nagios-plugins.org/doc/extra-opts.html
    for usage and examples.
Options:
 -H, --hostname=HOST
   Name of the host to check
 -p, --port=INTEGER
   Optional port number (default: 1248)  #默认端口号
 -s, --secret=<password>                 #指定的密码
   Password needed for the request
 -w, --warning=INTEGER
   Threshold which will result in a warning status
 -c, --critical=INTEGER
   Threshold which will result in a critical status
 -t, --timeout=INTEGER
   Seconds before connection attempt times out (default:  -l, --params=<parameters>
   Parameters passed to specified check (see below) -d, --display={SHOWALL}
   Display options (currently only SHOWALL works) -u, --unknown-timeout
   Return UNKNOWN on timeouts10)
 -h, --help
   Print this help screen
 -V, --version
   Print version information
 -v, --variable=STRING
   Variable to check

Valid variables are:
 CLIENTVERSION = Get the NSClient version
  If -l <version> is specified, will return warning if versions differ.
 CPULOAD =
  Average CPU load on last x minutes.
  Request a -l parameter with the following syntax:
  -l <minutes range>,<warning threshold>,<critical threshold>.
  <minute range> should be less than 24*60.
  Thresholds are percentage and up to 10 requests can be done in one shot.
  ie: -l 60,90,95,120,90,95
 UPTIME =
  Get the uptime of the machine.
  -l <unit>
  <unit> = seconds, minutes, hours, or days. (default: minutes)
  Thresholds will use the unit specified above.
 USEDDISKSPACE =
  Size and percentage of disk use.
  Request a -l parameter containing the drive letter only.
  Warning and critical thresholds can be specified with -w and -c.
 MEMUSE =
  Memory use.
  Warning and critical thresholds can be specified with -w and -c.
 SERVICESTATE =
  Check the state of one or several services.
  Request a -l parameters with the following syntax:
  -l <service1>,<service2>,<service3>,...
  You can specify -d SHOWALL in case you want to see working services
  in the returned string.
 PROCSTATE =
  Check if one or several process are running.
  Same syntax as SERVICESTATE.
 COUNTER =
  Check any performance counter of Windows NT/2000.
	Request a -l parameters with the following syntax:
	-l "\\<performance object>\\counter","<description>
	The <description> parameter is optional and is given to a printf
  output command which requires a float parameter.
  If <description> does not include "%%", it is used as a label.
  Some examples:
  "Paging file usage is %%.2f %%%%"
  "%%.f %%%% paging file used."
 INSTANCES =
  Check any performance counter object of Windows NT/2000.
  Syntax: check_nt -H <hostname> -p <port> -v INSTANCES -l <counter object>
  <counter object> is a Windows Perfmon Counter object (eg. Process),
  if it is two words, it should be enclosed in quotes
  The returned results will be a comma-separated list of instances on
   the selected computer for that object.
  The purpose of this is to be run from command line to determine what instances
   are available for monitoring without having to log onto the Windows server
    to run Perfmon directly.
  It can also be used in scripts that automatically create Nagios service
   configuration files.
  Some examples:
  check_nt -H 192.168.1.1 -p 1248 -v INSTANCES -l Process   #check_nt的语法

Notes:
 - The NSClient service should be running on the server to get any information
   (http://nsclient.ready2run.nl).
 - Critical thresholds should be lower than warning thresholds
 - Default port 1248 is sometimes in use by other services. The error
   output when this happens contains "Cannot map xxxxx to protocol number".
   One fix for this is to change the port to something else on check_nt
   and on the client service it's connecting to.

Send email to help@nagios-plugins.org if you have questions regarding use
of this software. To submit patches or suggest improvements, send email to
devel@nagios-plugins.org
2、check_nt命令的使用
check_nt参数解释
-w:警告比例
-c:紧急比例
-l:过去5分钟的平均值,80%的警告 90%紧急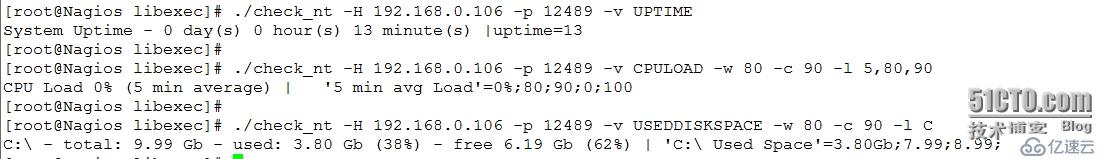
四、定义命令、主机、服务
1、定义命令
[root@Nagios ~]# vim /usr/local/nagios/etc/objects/commands.cfg
# 'check_win' command definition
define command{
        command_name    check_win
        command_line    $USER1$/check_nt -H $HOSTADDRESS$ -p 12489 -v $ARG1$ $ARG2$
        }
注释:
$..$    表示系统内置的宏,也就是所谓的变量
$USER1$ 表示插件所在的目录
-H      指定主机地址
$HOSTADDRESS$  应用到哪个主机,就用哪个主机的地址
$ARG1$  传递的参数,形参
-s      指定密码 默认为空
2、定义主机和服务
[root@Nagios objects]# cp windows.cfg windows106.cfg
[root@Nagios objects]# sed -i 's/winserver/Windows106/g' windows106.cfg
[root@Nagios objects]# sed -i 's/192.168.1.2/192.168.0.106/' windows106.cfg
4、检测配置文件是否有语法错误
[root@Nagios ~]# service nagios configtest

Nagios Core 4.0.7
Copyright (c) 2009-present Nagios Core Development Team and Community Contributors
Copyright (c) 1999-2009 Ethan Galstad
Last Modified: 06-03-2014
License: GPL

Website: http://www.nagios.org
Reading configuration data...
   Read main config file okay...
   Read object config files okay...

Running pre-flight check on configuration data...

Checking objects...
	Checked 8 services.
	Checked 1 hosts.
	Checked 1 host groups.
	Checked 0 service groups.
	Checked 1 contacts.
	Checked 1 contact groups.
	Checked 25 commands.
	Checked 5 time periods.
	Checked 0 host escalations.
	Checked 0 service escalations.
Checking for circular paths...
	Checked 1 hosts
	Checked 0 service dependencies
	Checked 0 host dependencies
	Checked 5 timeperiods
Checking global event handlers...
Checking obsessive compulsive processor commands...
Checking misc settings...

Total Warnings: 0
Total Errors:   0

Things look okay - No serious problems were detected during the pre-flight check
Object precache file created:
/usr/local/nagios/var/objects.precache
5、重启nagios服务
[root@Nagios objects]# service nagios restart
Running configuration check...
Stopping nagios: .done.
Starting nagios: done.
四、浏览器查看监控信息
1、登陆后点击【Hosts】,查看新监控的Windows主机信息

2、点击【Services】,查看Windows服务的状态信息
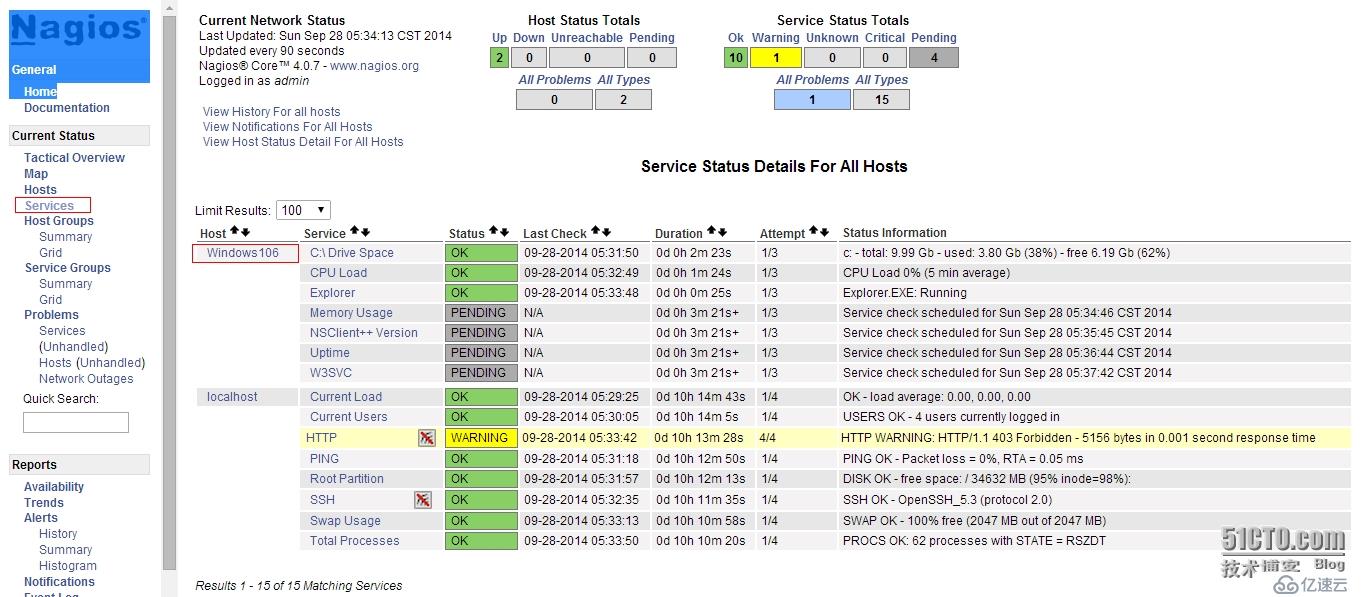
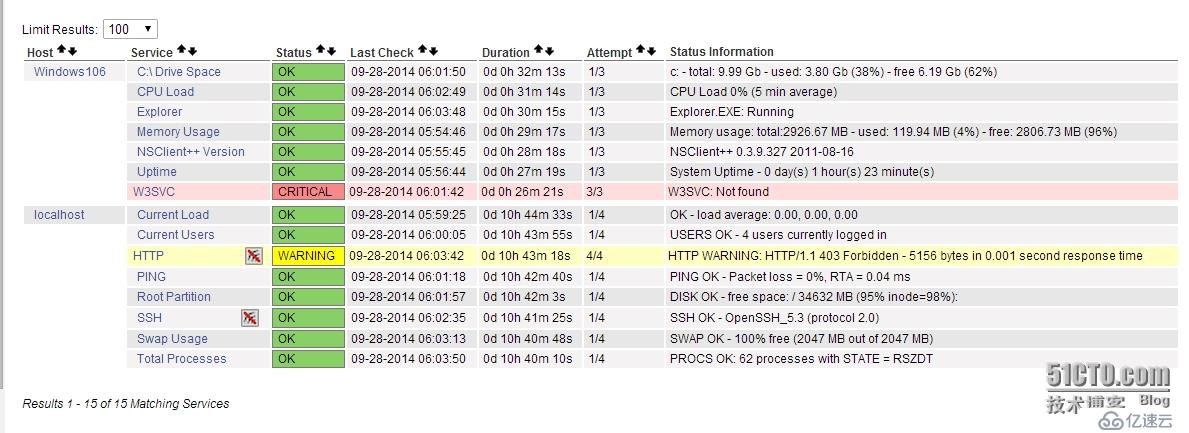
3、等待几分钟后状态就正常了,如下图所示
三、NRPE的方式监控windows主机
1、修改NSClient++的配置文件
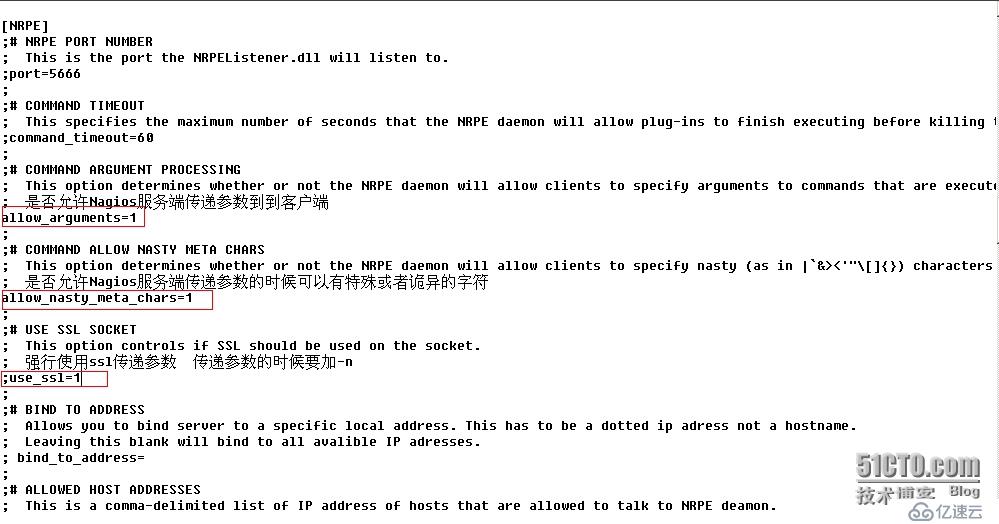
2、重新启动NSClient++服务
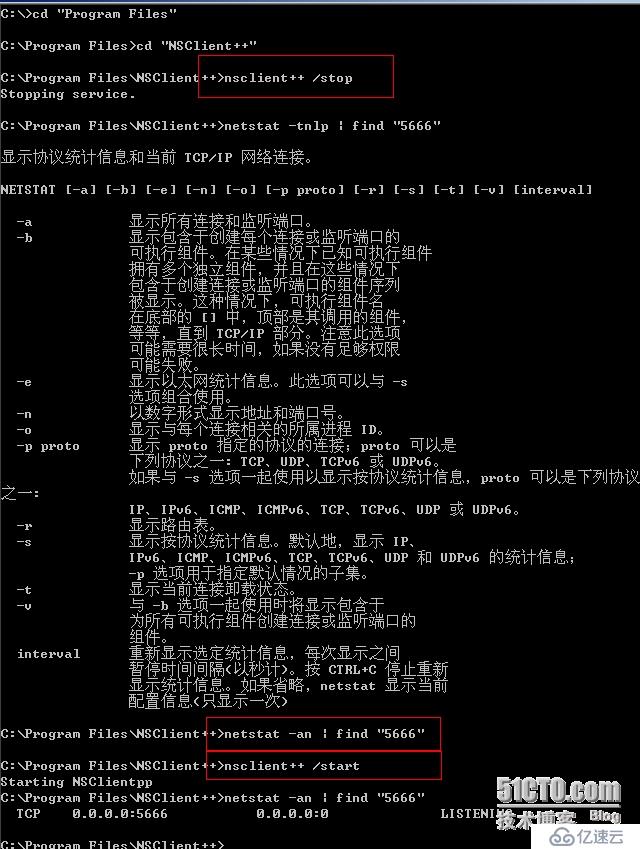
3、Nagios服务端测试NRPE命令
[root@Nagios ~]# cd /usr/local/nagios/libexec/
[root@Nagios libexec]# ./check_nrpe -h

NRPE Plugin for Nagios
Copyright (c) 1999-2008 Ethan Galstad (nagios@nagios.org)
Version: 2.15
Last Modified: 09-06-2013
License: GPL v2 with exemptions (-l for more info)
SSL/TLS Available: Anonymous DH Mode, OpenSSL 0.9.6 or higher required

Usage: check_nrpe -H <host> [ -b <bindaddr> ] [-4] [-6] [-n] [-u] [-p <port>] [-t <timeout>] [-c <command>] [-a <arglist...>]

Options:
 -n         = Do no use SSL
 -u         = Make socket timeouts return an UNKNOWN state instead of CRITICAL
 <host>     = The address of the host running the NRPE daemon
 <bindaddr> = bind to local address
 -4         = user ipv4 only
 -6         = user ipv6 only
 [port]     = The port on which the daemon is running (default=5666)
 [timeout]  = Number of seconds before connection times out (default=10)
 [command]  = The name of the command that the remote daemon should run
 [arglist]  = Optional arguments that should be passed to the command.  Multiple
              arguments should be separated by a space.  If provided, this must be
              the last option supplied on the command line.

Note:
This plugin requires that you have the NRPE daemon running on the remote host.
You must also have configured the daemon to associate a specific plugin command
with the [command] option you are specifying here.  Upon receipt of the
[command] argument, the NRPE daemon will run the appropriate plugin command and
send the plugin output and return code back to *this* plugin.  This allows you
to execute plugins on remote hosts and 'fake' the results to make Nagios think
the plugin is being run locally.


check_nrpe语法:
check_nrpe ... -c <command> [-a <argument> <argument> <argument>]


check_nrpe的内置命令:
· CheckAlwaysCRITICAL (check)
· CheckAlwaysOK (check)
· CheckAlwaysWARNING (check)
· CheckCPU (check)
· CheckCRITICAL (check)
· CheckCounter (check)
· CheckEventLog/CheckEventLog (check)
· CheckFile (check)
· CheckFileSize (check)
· CheckMem (check)
· CheckMultiple (check)
· CheckOK (check)
· CheckProcState (check)
· CheckServiceState (check)
· CheckTaskSched/CheckTaskSched (check)
· CheckUpTime (check)
· CheckVersion (check)
· CheckWARNING (check)
· CheckWMI/CheckWMI (check)
· CheckWMIValue (check)
[root@Nagios libexec]# ./check_nrpe -H 192.168.1.142 -p 5666 -c CheckCPU -a warn=80 crit=90 time=20m time=10s time=4
OK CPU Load ok.|'20m'=0%;80;90 '10s'=0%;80;90 '4'=0%;80;90
免责声明:本站发布的内容(图片、视频和文字)以原创、转载和分享为主,文章观点不代表本网站立场,如果涉及侵权请联系站长邮箱:is@yisu.com进行举报,并提供相关证据,一经查实,将立刻删除涉嫌侵权内容。