您好,登录后才能下订单哦!
简介
tensorflow 配套的可视化工具, 将你的计算图画出来.
当训练一个巨大的网络的时候, 计算图既复杂又令人困惑. TensorBoard 提供了一系列的组件, 可以看到 learning rate 的变化, 看到 objective function 的变化.
tfboard 读取 tf 运行时你记下的 events files, 来进行可视化. 这些 events files 包含了你记下的 summary data, 它是 protobuffer 格式, 并非文本文件.
推荐使用 Estimator 风格.
类与方法
在 tf.estimator 框架下, 可以直接用 tf.summary.scalar() 这样的方法, 不必显式地创建writer并调用writer.add_summary()
tensorflow.python.summary.writer.writer.FileWriter(SummaryToEventTransformer)
类.
__init__(self, logdir, graph=None,...)
构造函数, Creates a FileWriter and an event file.
tensorflow.python.summary.summary
模块.
scalar(name, tensor, ..) Outputs a Summary protocol buffer containing a single scalar value.
histogram(name, values, collections=None, family=None) Adding a histogram summary makes it possible to visualize your data's distribution in TensorBoard.
image
作图, 对于grap-scale 图来讲, 0表示全黑, 255表示全白.
api, image(name, tensor, max_outputs=3, collections=None, family=None) Outputs a Summary protocol buffer with images. images are built from tensor which must be 4-D with shape [batch_size, height, width, channels] and where channels can be:
1.1-tensor is interpreted as Grayscale.
2.3-tensor is interpreted as RGB.
3.4-tensor is interpreted as RGBA.
tensor为float: 此时, tf会内部作正规化处理, 转换到[0,255](解析 tf_events 即可验证), float通常对应于 softm 之后的概率, 值域为[0,1].
tensor为uint8, 保持不变, tf 不作任何内部转换.
attention 可视化, attention 的权重会作 soft-max 处理, 通常img显示的效果是, 一行看下来有深有浅, 颜色越白weight越大. 但有时后tf内部正规化不符合预期, 出现一行全白的情况, 稳妥起见自己转unit类型.
打开web页面
在命令行中 敲tensorboard --logdir=D:\tf_models\iris, 根据提示打开URL即可.
比如我的为http://yichu-amd:6006/.
效果截图

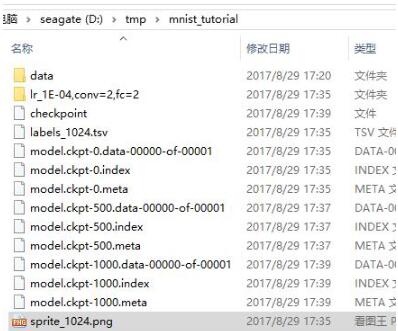
图3-1 logdir中的文件

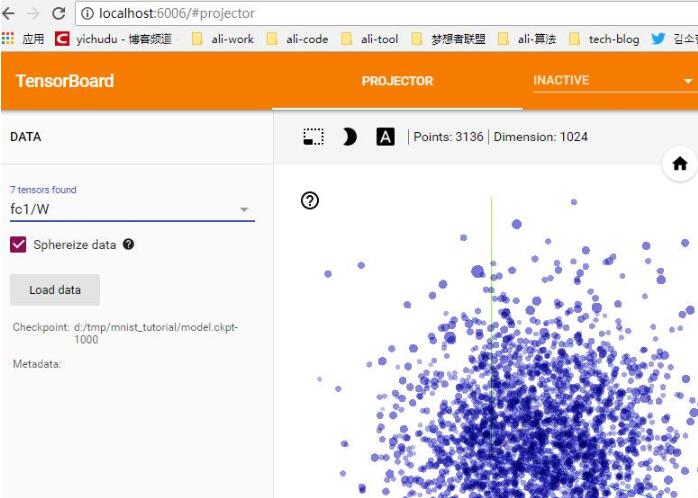
图3-2 炫酷的可视化效果

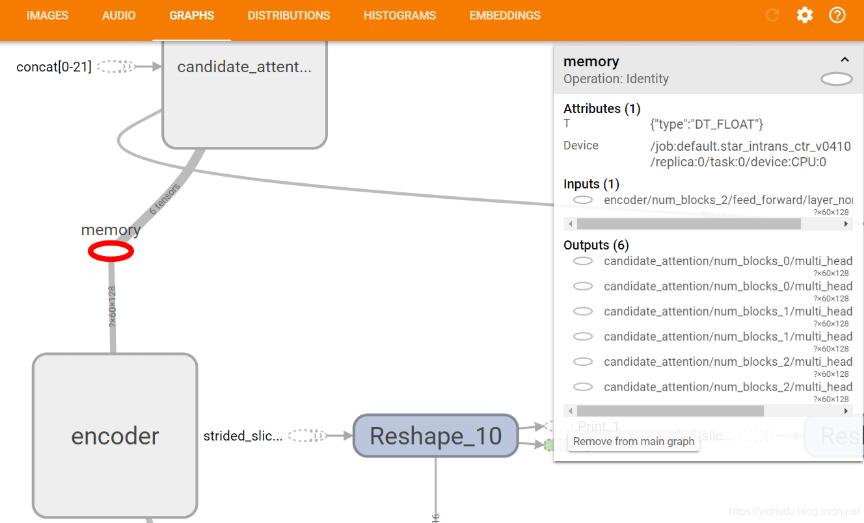
figure 3-3 计算图的可视化
给出一些建议:
网络也是分模块,有结构的, 合理使用 scope 可以让计算图清晰优雅.
有些tensor来自dataset, 有些来自api中op操作的输出, 本身没有明确的名字, 此时用x=tf.identity(x,'name') 给tensor起名字, 便于计算图中定位. 图3-3 中的 memory 就是 encoder 的输出的tensor.
以上这篇TensorBoard 计算图的可视化实现就是小编分享给大家的全部内容了,希望能给大家一个参考,也希望大家多多支持亿速云。
免责声明:本站发布的内容(图片、视频和文字)以原创、转载和分享为主,文章观点不代表本网站立场,如果涉及侵权请联系站长邮箱:is@yisu.com进行举报,并提供相关证据,一经查实,将立刻删除涉嫌侵权内容。