您好,登录后才能下订单哦!
密码登录
登录注册
点击 登录注册 即表示同意《亿速云用户服务条款》
本篇文章为大家展示了如何入门Prometheus,内容简明扼要并且容易理解,绝对能使你眼前一亮,通过这篇文章的详细介绍希望你能有所收获。
1、Prometheus简介
Prometheus最开始是由SoundCloud公司开源的一款监控软件,自从2012年成立以来许多的公司和组织都在使用Prometheus
官方GitHub地址为:https://github.com/prometheus/prometheus
官方地址:https://prometheus.io/
2、Prometheus特点
一个多维数据模型,其中包含通过度量标准名称和key/value对标识的时间序列数据
PromQL,一种灵活的查询语言,可以利用此维度
不依赖分布式存储,单个服务器节点可以直接工作
基于HTTP的pull方式采集时间序列
推送时间序列通过PushGateway组件支持
通过服务发现或静态配置发现目标
多种图形和仪表板支持模式(grafana)
组件
Prometheus Server,主要用于抓取数据和存储时序数据,另 外还提供查询和 Alert Rule 配置管理。
Alertmanager,主要是负责实现报警功能。
Push Gateway ,用于批量,短期的监控数据的汇总节点,实现接收由Client push过来的各种指标数据,在指定的时间间隔,由主程序访问抓取。
*_exporter,各种汇报数据的。
基础架构
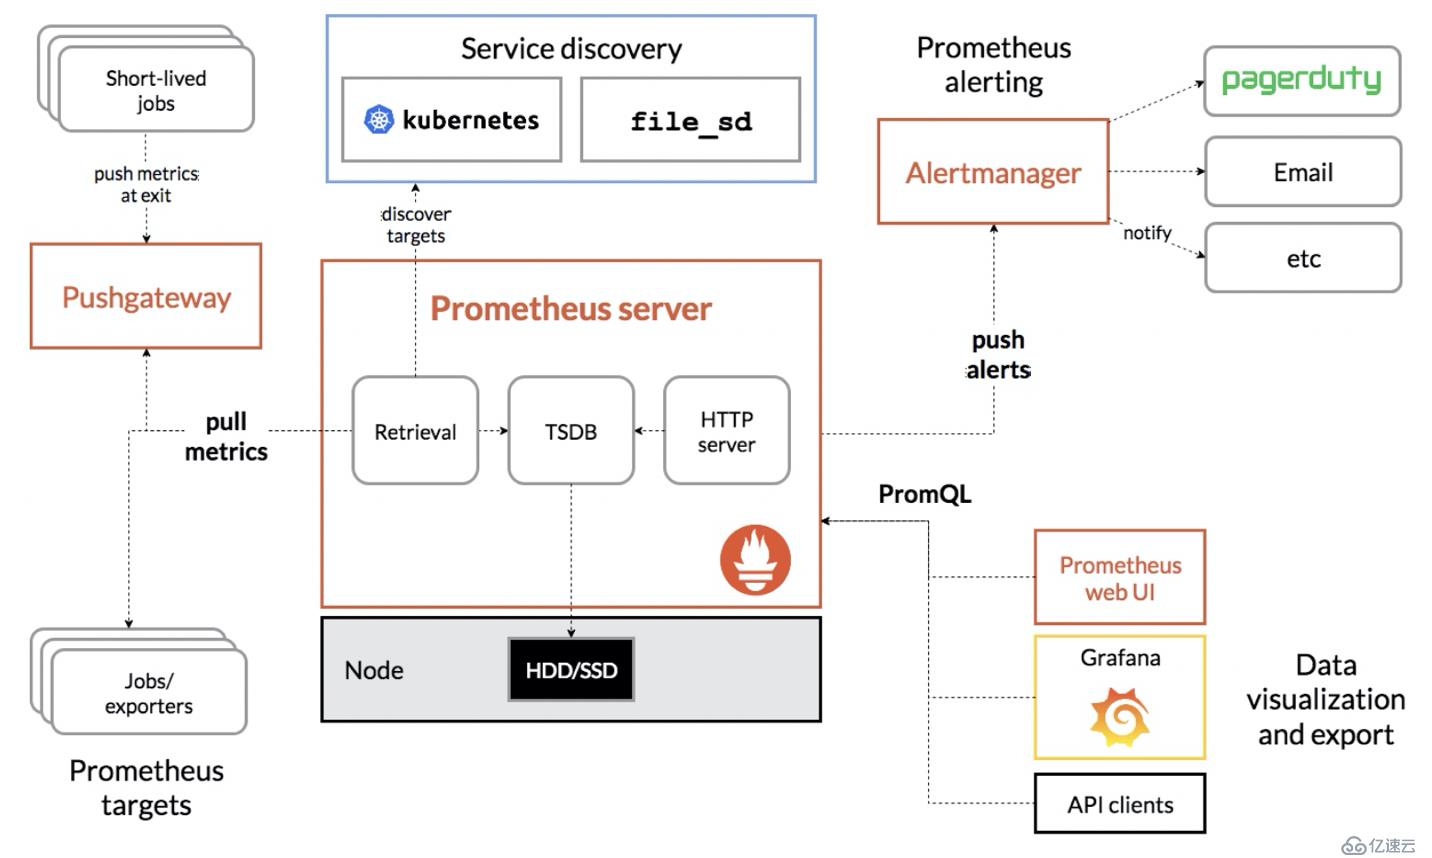
从这个架构图,也可以看出 Prometheus 的主要模块包含, Server, Exporters, Pushgateway, PromQL, Alertmanager, WebUI 等。
它大致使用逻辑是这样:
Prometheus server 定期从静态配置的targets或者服务发现的targets拉取数据。
当新拉取的数据大于配置内存缓存区的时候,Prometheus会将数据持久化到磁盘(如果使用Remote Storage将持久化到云端)。
Prometheus可以配置rules,然后定时查询数据,当条件触发的时候,会将alert 推送到配置的Alertmanager。
Alertmanager收到警告的时候,可以根据配置,聚合,去重,降噪,最后发送警告。
可以使用API, Prometheus Console 或者Grafana查询和聚合数据。
Prometheus vs Zabbix
Zabbix 使用的是 C 和 PHP, Prometheus 使用 Golang, 整体而言 Prometheus 运行速度更快一点
Zabbix 属于传统主机监控,主要用于物理主机,交换机,网络等 监控,Prometheus 不仅适用主机监控,还适用于 Cloud, SaaS, Openstack,Container 监控
Zabbix 在传统主机监控方面,有更丰富的插件
Zabbix 可以在 WebGui 中配置很多事情,但是 Prometheus 需要手动修改文件配置
3、Prometheus部署
1.下载安装包prometheus-2.4.0.linux-amd64.tar.gz
github下载地址:https://github.com/prometheus/prometheus/releases/tag/v2.4.0
2.解压
$ tar xf prometheus-2.14.0.linux-amd64.tar.gz -C /usr/local/
$ ln -s /usr/local/prometheus-2.14.0.linux-amd64/ /usr/local/prometheus
创建system
$ vim /etc/systemd/system/prometheus.service
[root@linux-node1 ~]# vim /etc/systemd/system/prometheus.service
[Unit]
Description=Prometheus
Wants=network-online.target
After=network-online.target

[Service]
User=root
Group=root
Type=simple
ExecStart=/usr/local/prometheus/prometheus \
--config.file=/usr/local/prometheus/prometheus.yml

[Install]
WantedBy=multi-user.target
3.配置prometheus.yml (保持默认配置)
$ vim /usr/local/prometheus/prometheus.yml
# my global config
global:
  scrape_interval:     15s # Set the scrape interval to every 15 seconds. Default is every 1 minute.
  evaluation_interval: 15s # Evaluate rules every 15 seconds. The default is every 1 minute.
  # scrape_timeout is set to the global default (10s).

# Alertmanager configuration
alerting:
  alertmanagers:
  - static_configs:
    - targets:
      # - alertmanager:9093

# Load rules once and periodically evaluate them according to the global 'evaluation_interval'.
rule_files:
  # - "first_rules.yml"
  # - "second_rules.yml"

# A scrape configuration containing exactly one endpoint to scrape:
# Here it's Prometheus itself.
scrape_configs:
  # The job name is added as a label `job=<job_name>` to any timeseries scraped from this config.
  - job_name: 'prometheus'

    # metrics_path defaults to '/metrics'
    # scheme defaults to 'http'.

    static_configs:
    - targets: ['localhost:9090']
4.启动
$ systemctl daemon-reload
$ systemctl start prometheus.service
$ systemctl enable prometheus.service

// Prometheus Server端启动默认端口 - 9090
$ netstat -lntup | grep "9090"
tcp6       0      0 :::9090                 :::*                    LISTEN      3393/./prometheus
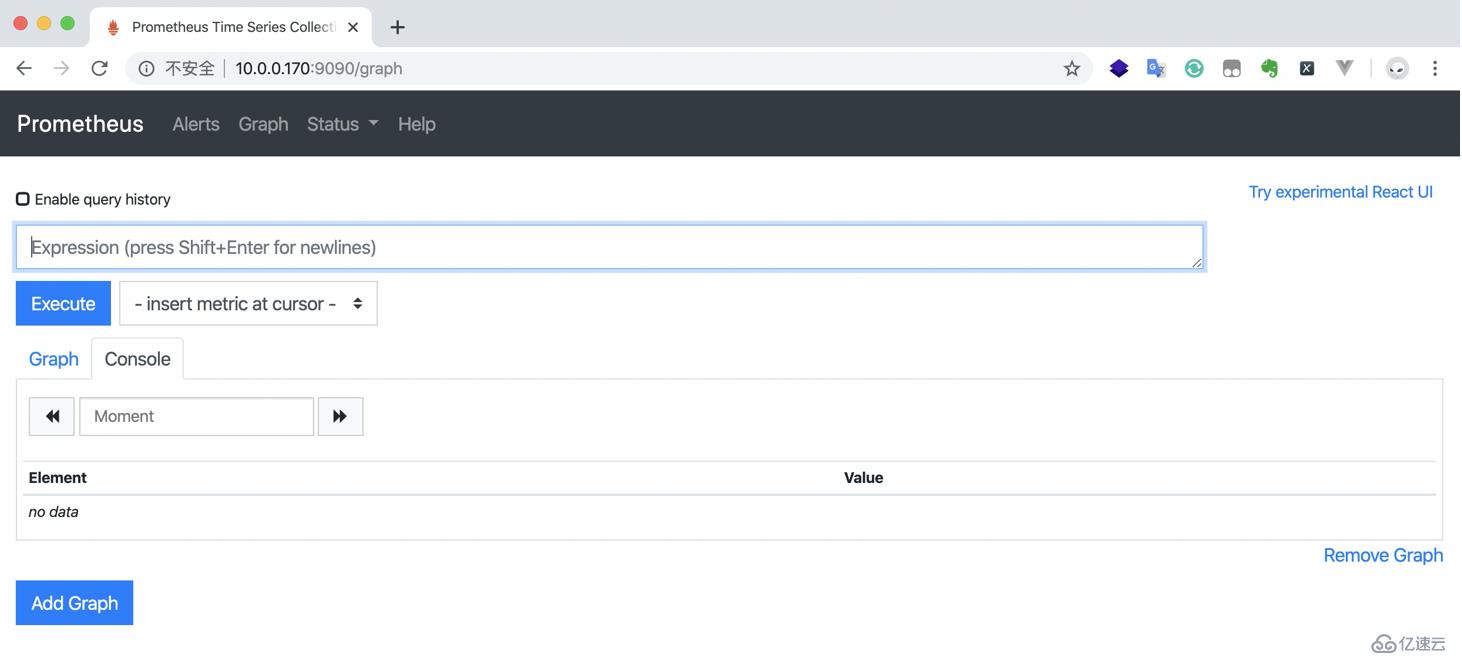
5.访问http://ip:9090/Prometheus自带的监控界面
4、Grafana部署Grafana是一款采用go语言编写的开源应用,主要用于大规模指标数据的可视化展现,是网络架构和应用分析中最流行的时序数据展示工具,目前已经支持绝大部分常用的时序数据库。
Grafana支持许多不同的数据源。每个数据源都有一个特定的查询编辑器,该编辑器定制的特性和功能是公开的特定数据来源。 官方支持以下数据源:Graphite,Elasticsearch,InfluxDB,Prometheus,Cloudwatch,MySQL和OpenTSDB等。
Grafana文档:https://grafana.com/docs/grafana/latest/installation/rpm/
1.安装Grafana
这里使用rpm包安装
$ wget https://mirrors.tuna.tsinghua.edu.cn/grafana/yum/rpm/grafana-6.3.7-1.x86_64.rpm
$ rpm -i --nodeps grafana-6.3.7-1.x86_64.rpm
2.启动Grafana,并加入开机自启
$ systemctl start grafana-server.service
$ systemctl enable grafana-server.service

// Grafana 启动默认端口 - 3000
$ netstat -lntup | grep "3000"
tcp6       0      0 :::3000                 :::*                    LISTEN      3585/grafana-server
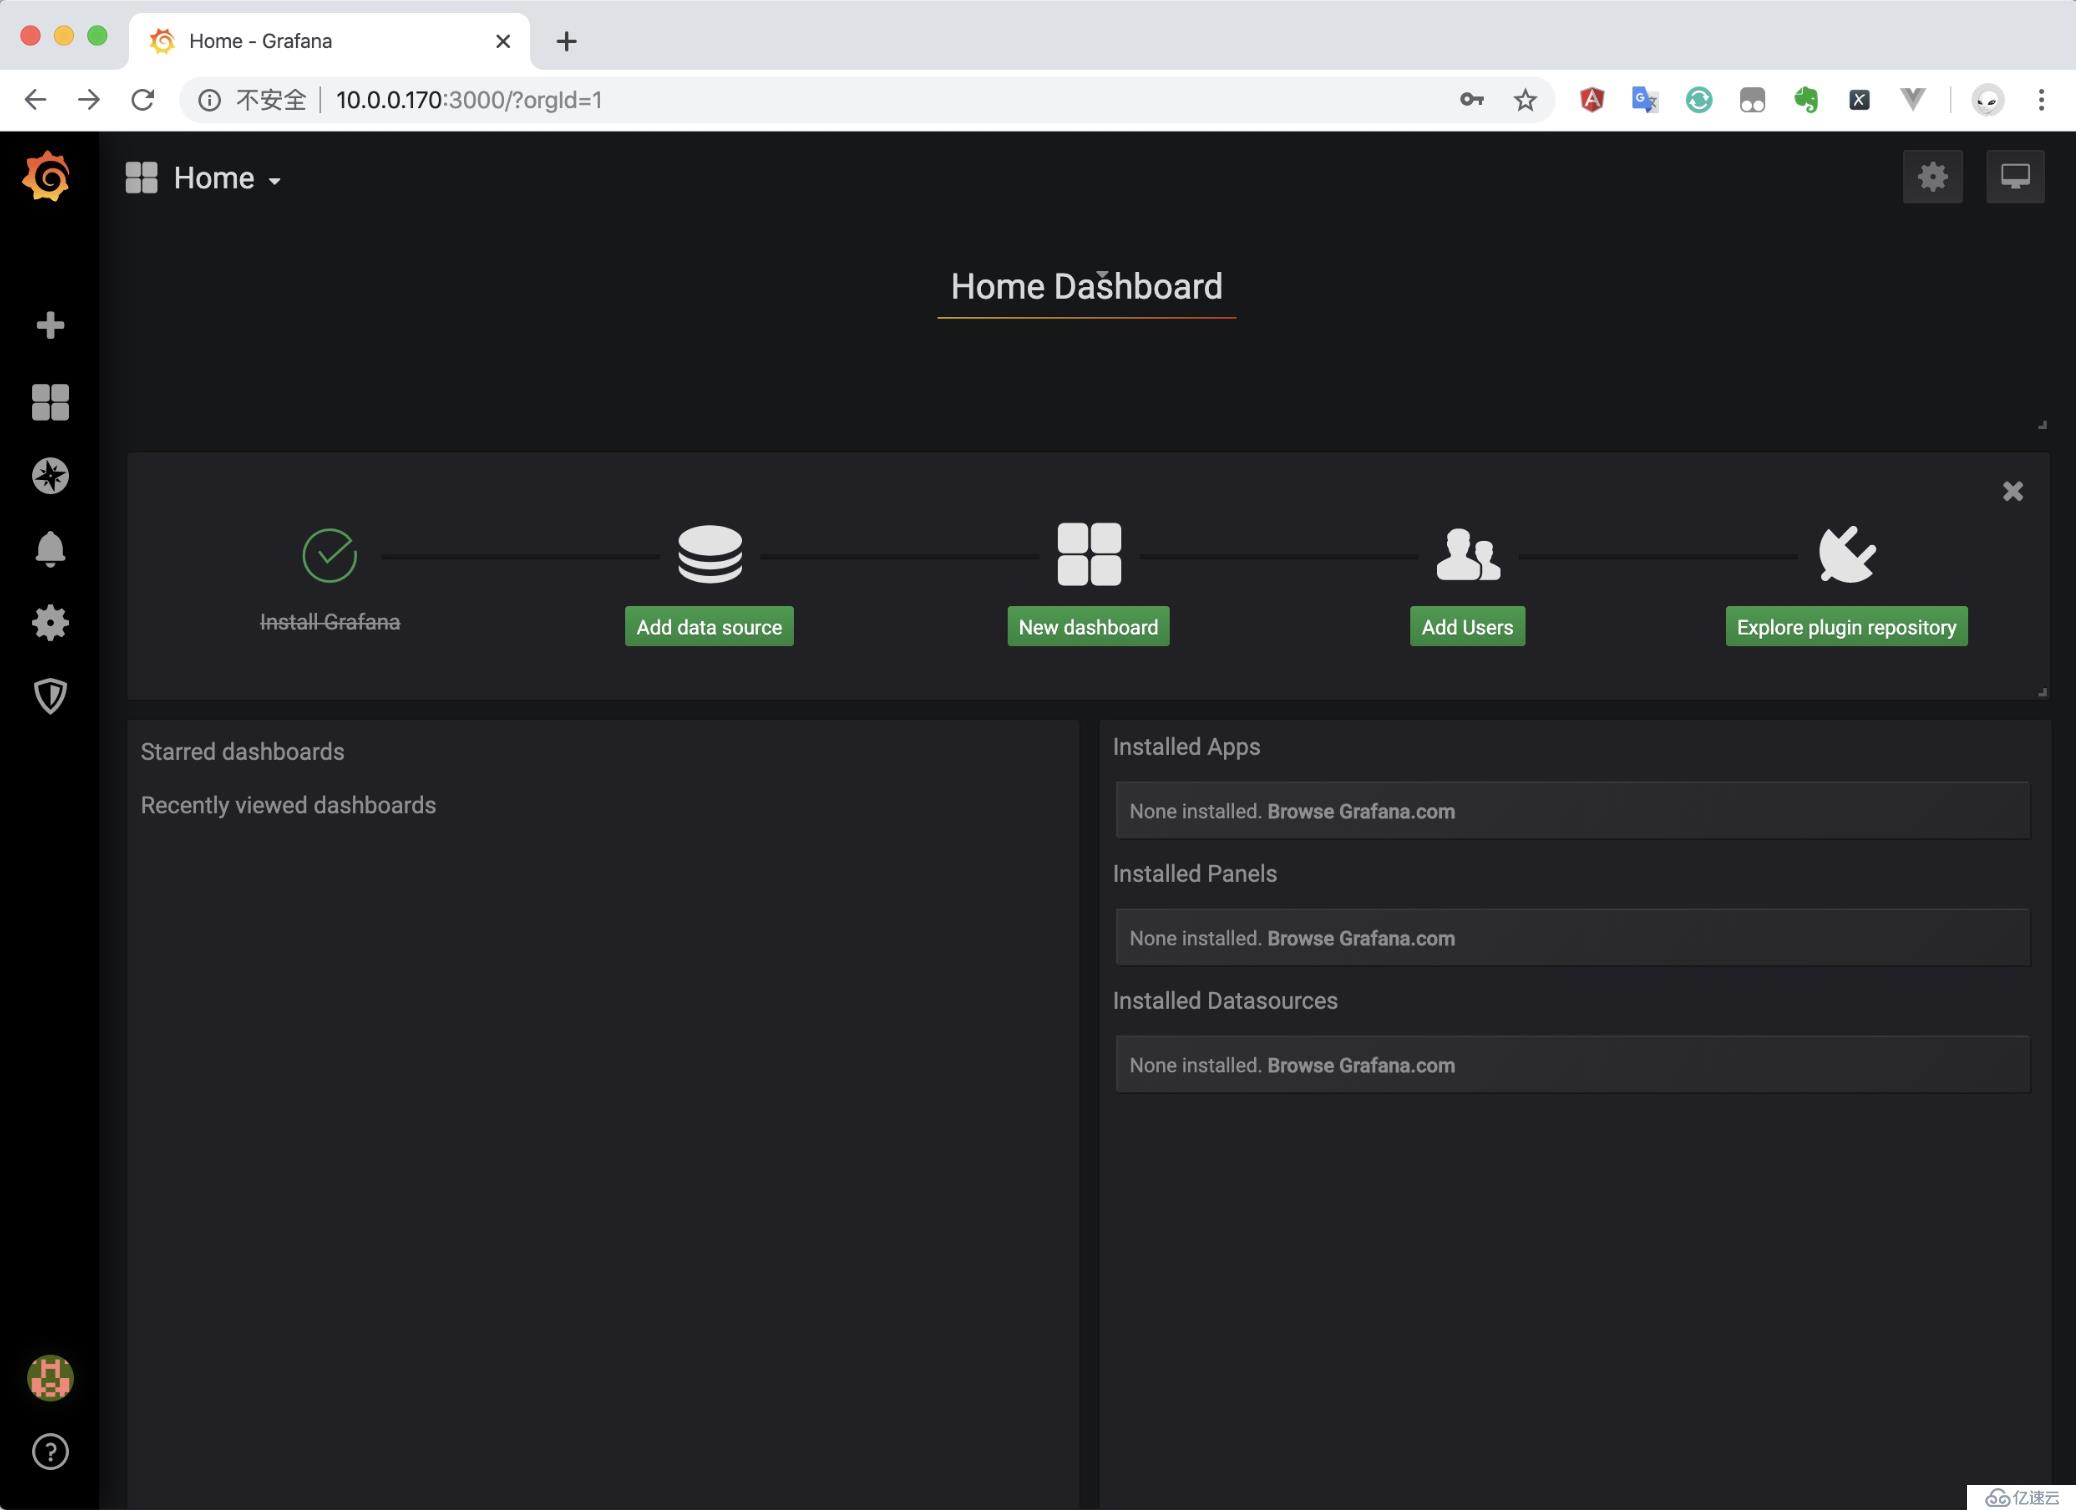
3.访问grafana
浏览器访问IP:3000端口,即可打开grafana页面,默认用户名密码都是admin,初次登录会要求修改默认的登录密码
4.添加数据源
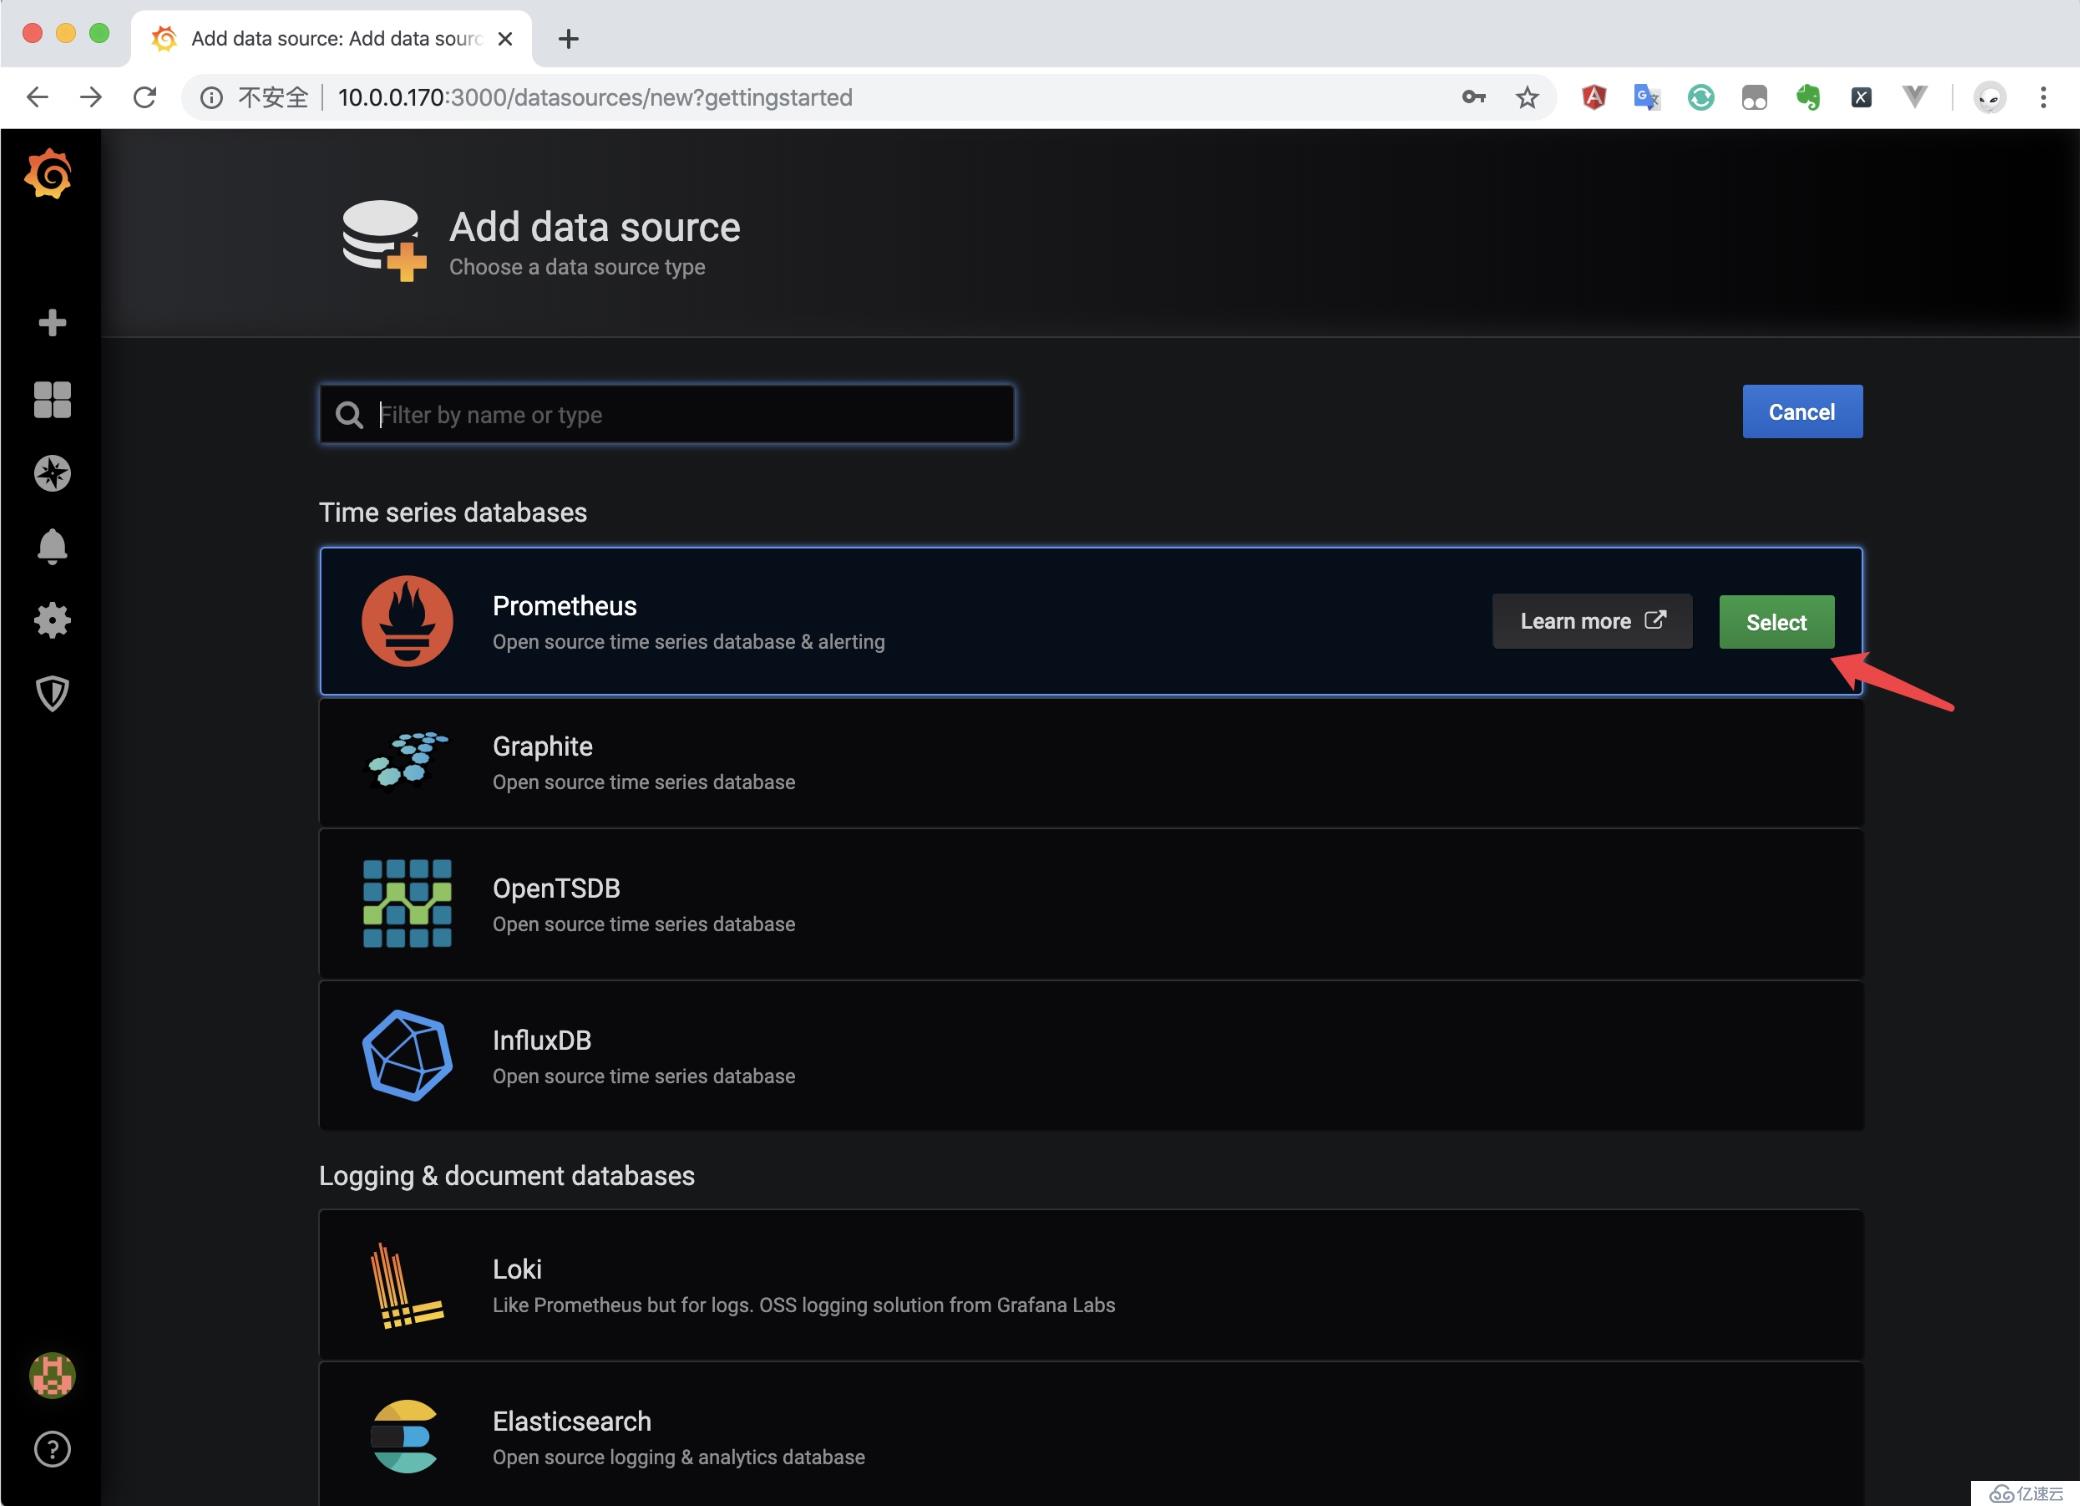
(1)点击主界面的“Add data source”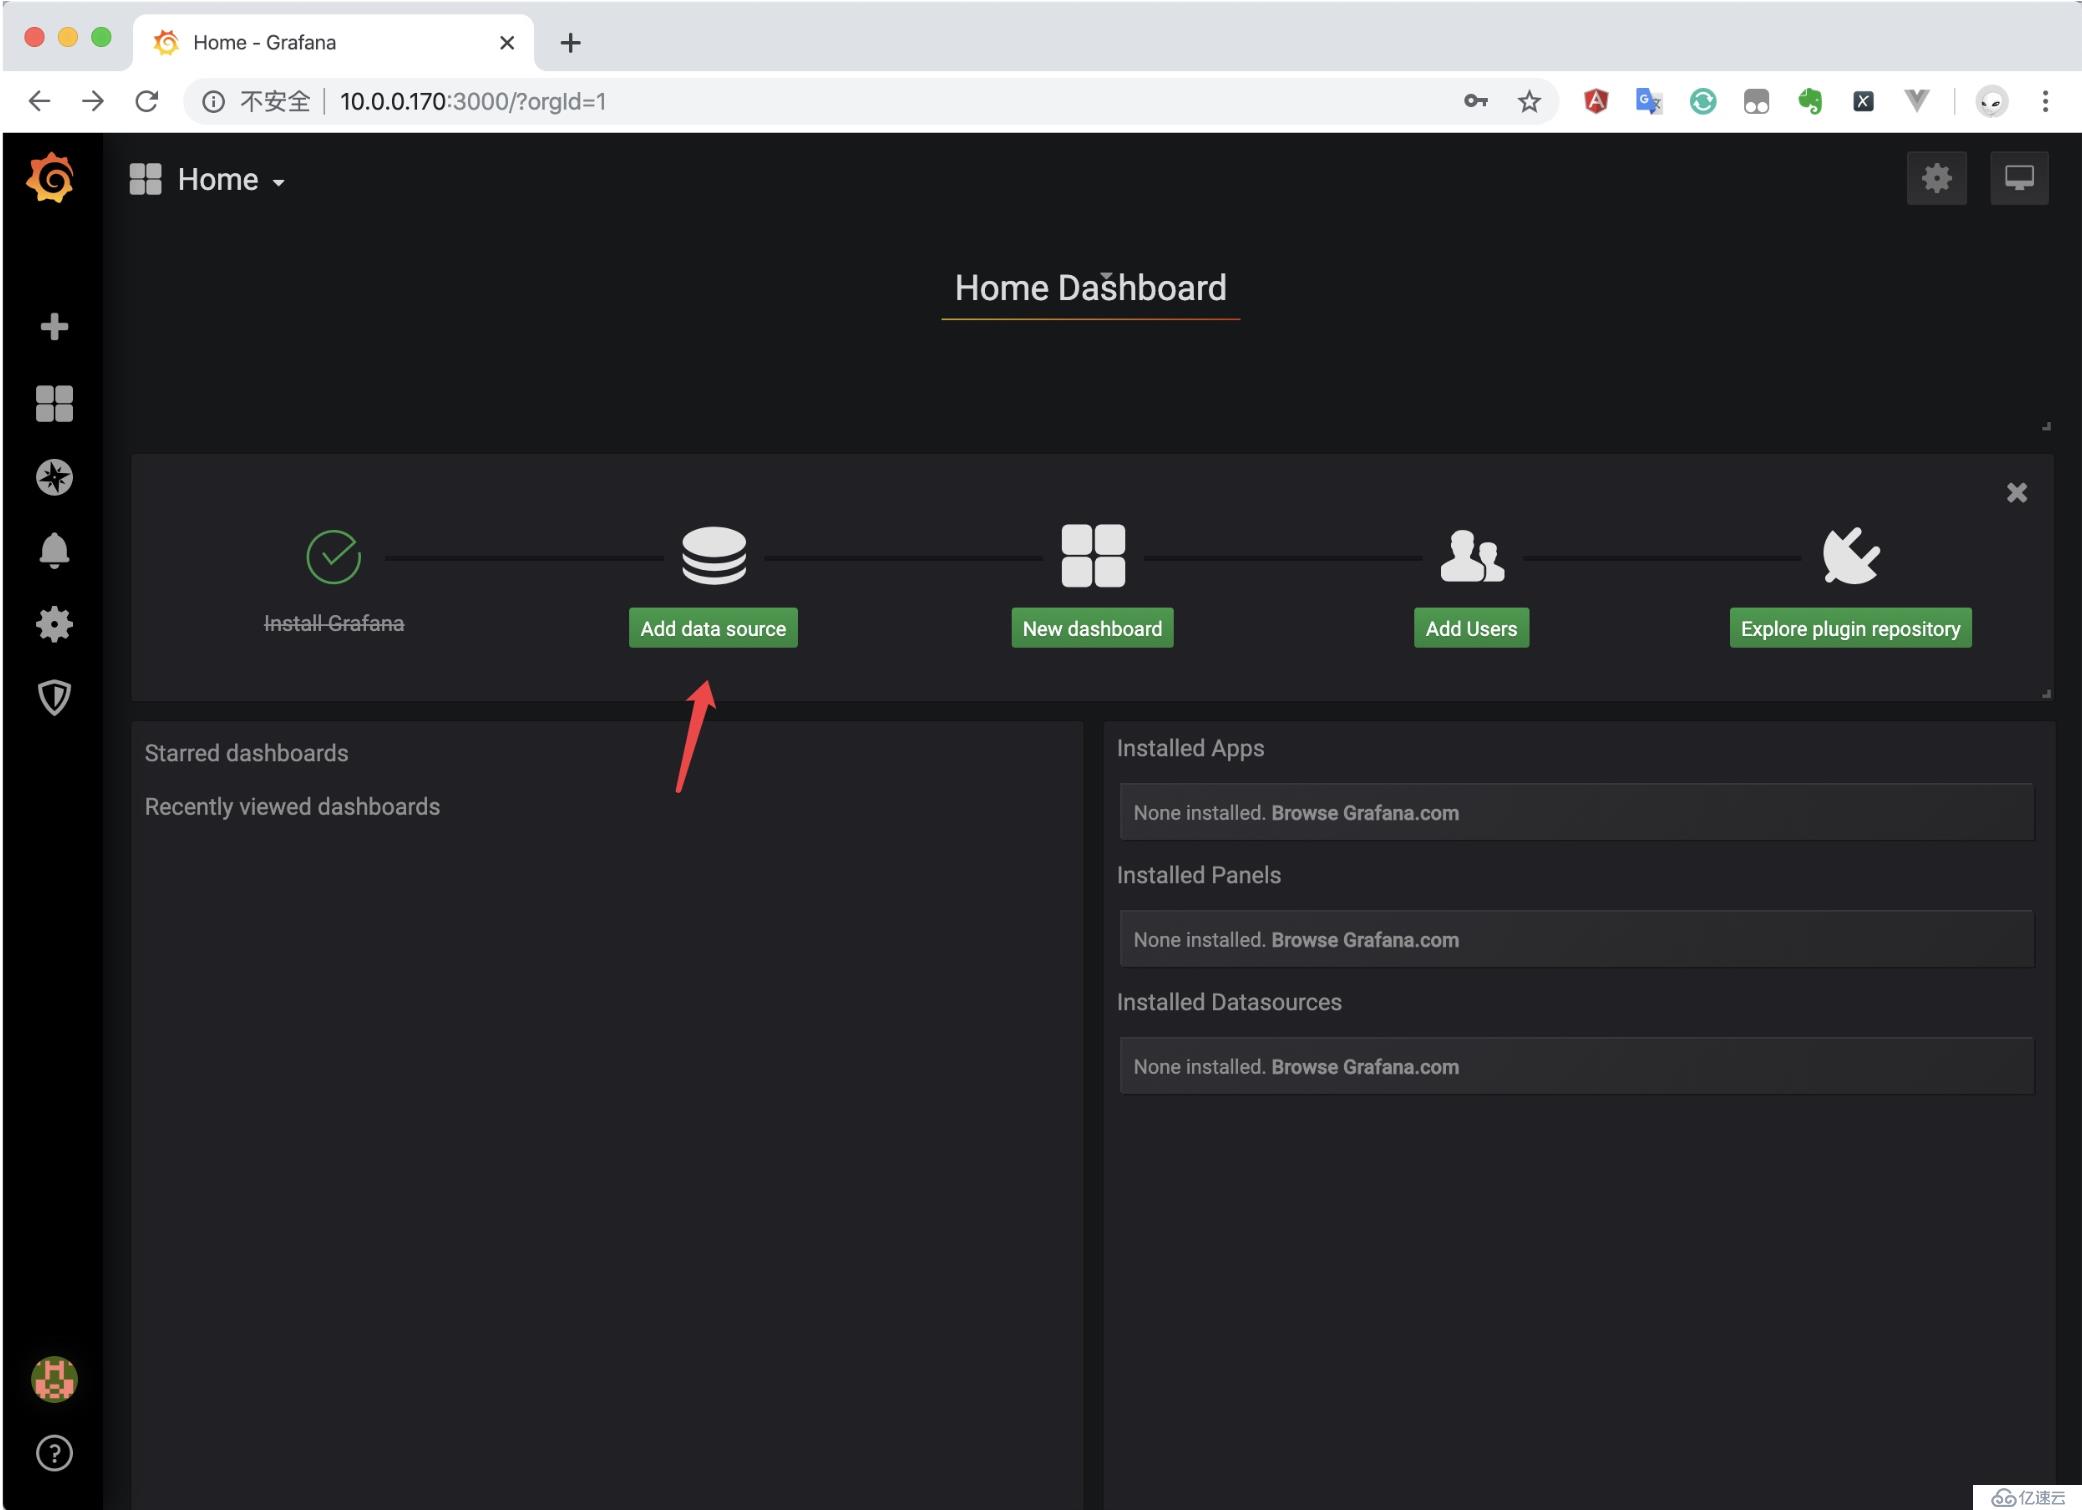
(2)选择Prometheus
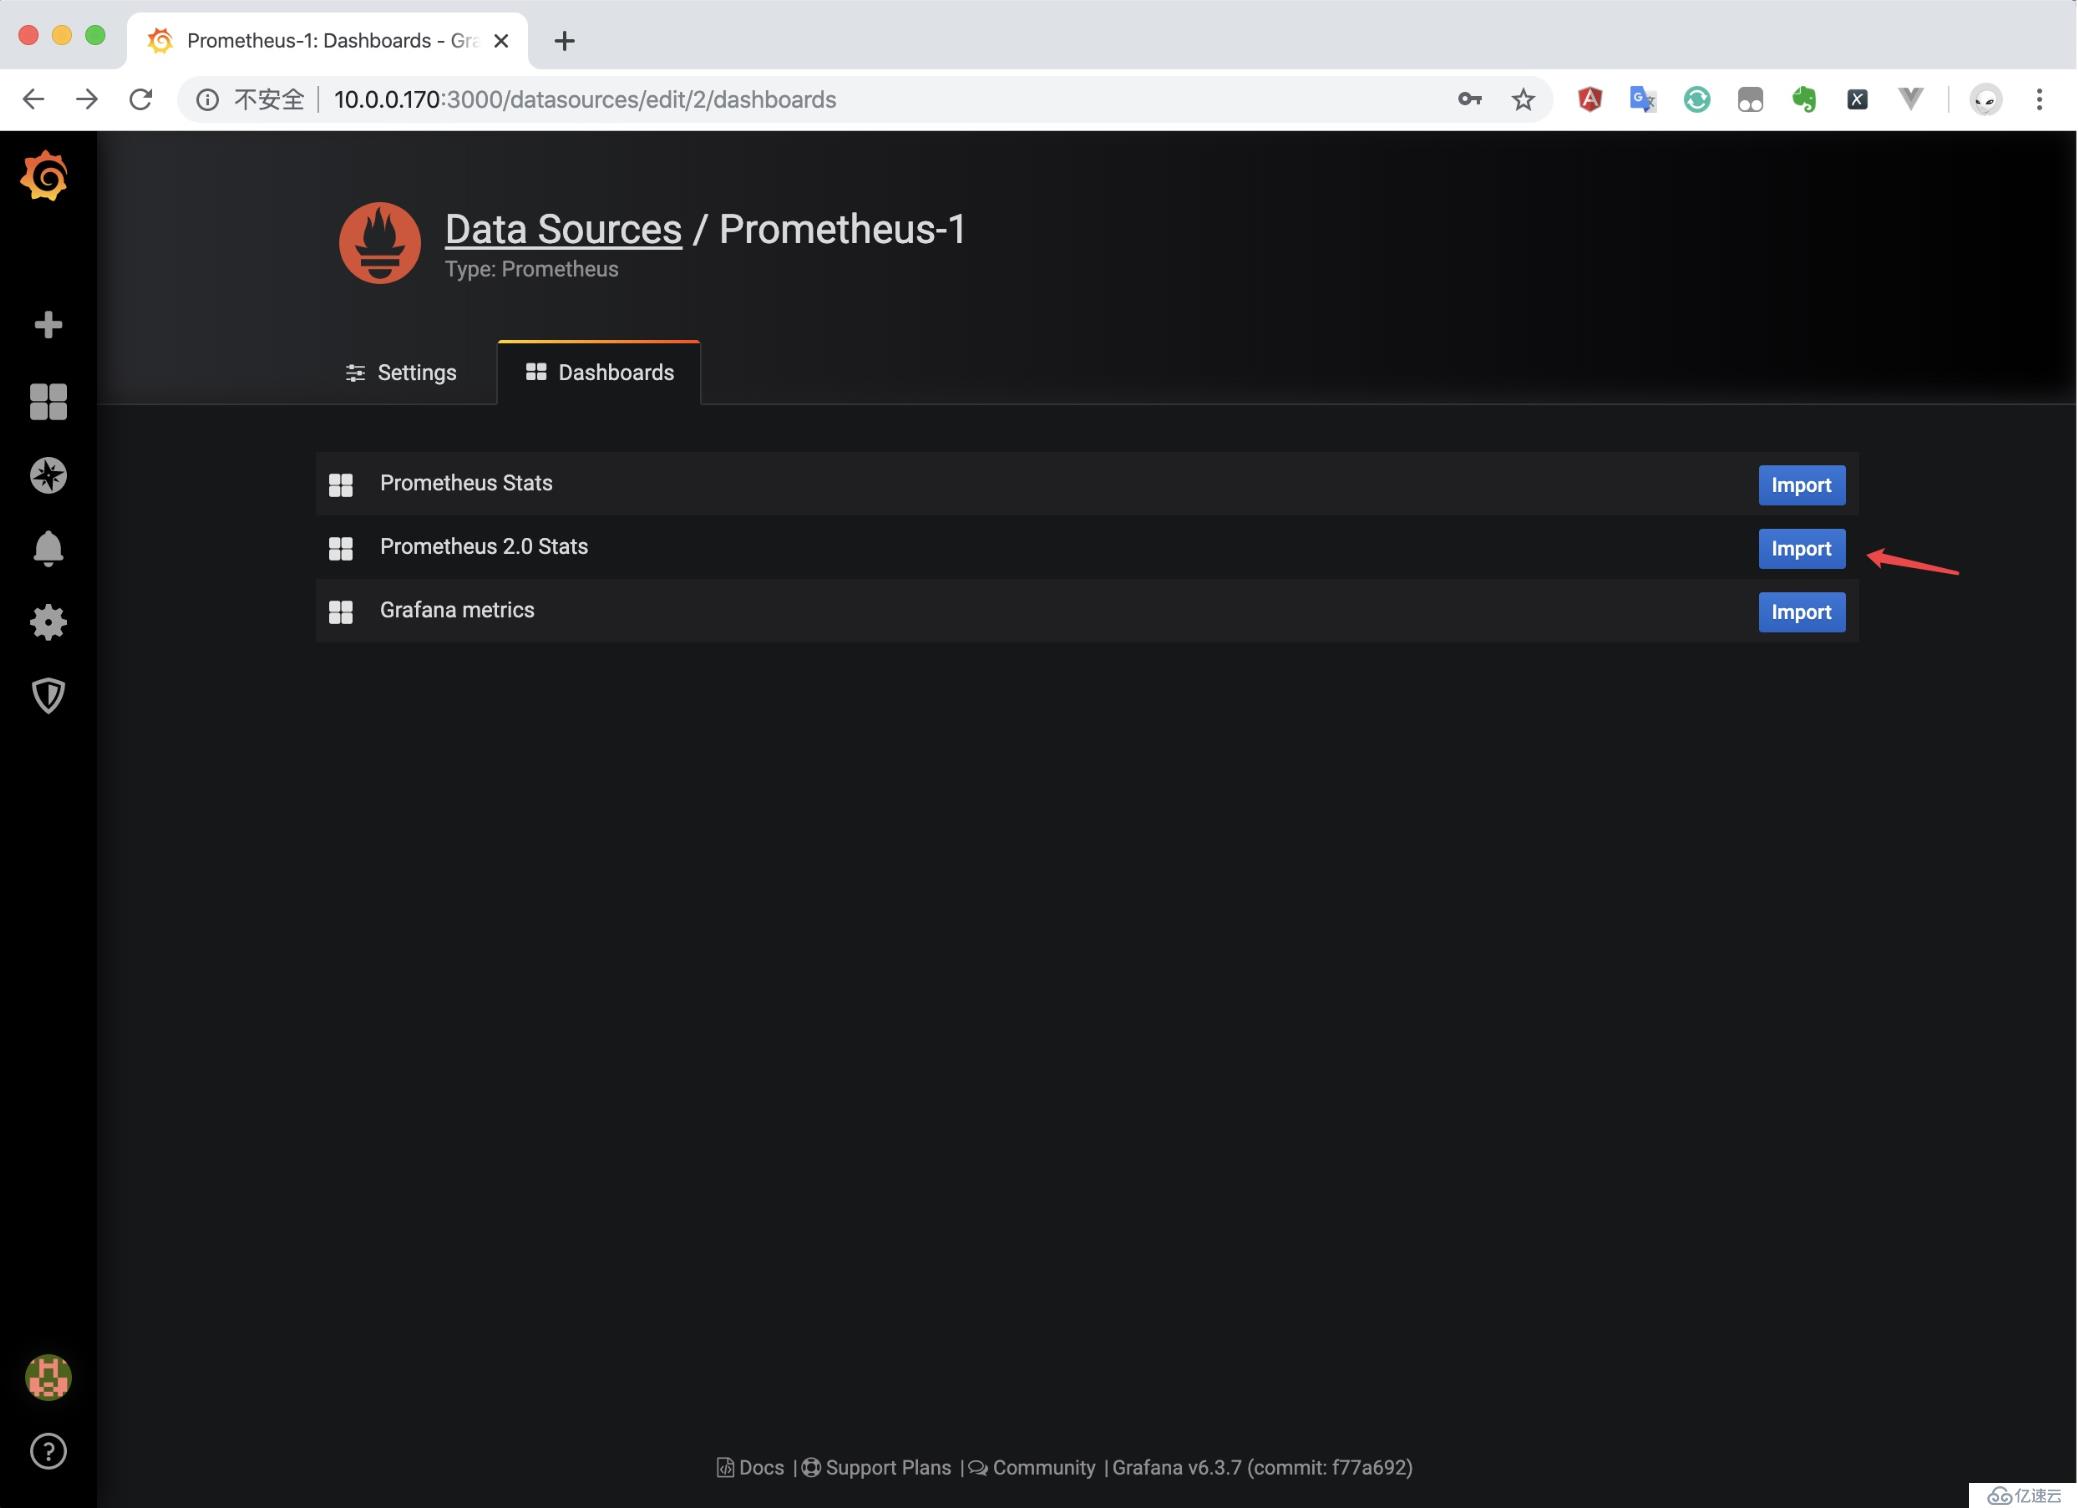
(3)Dashboards页面选择Prometheus 2.0 Stats
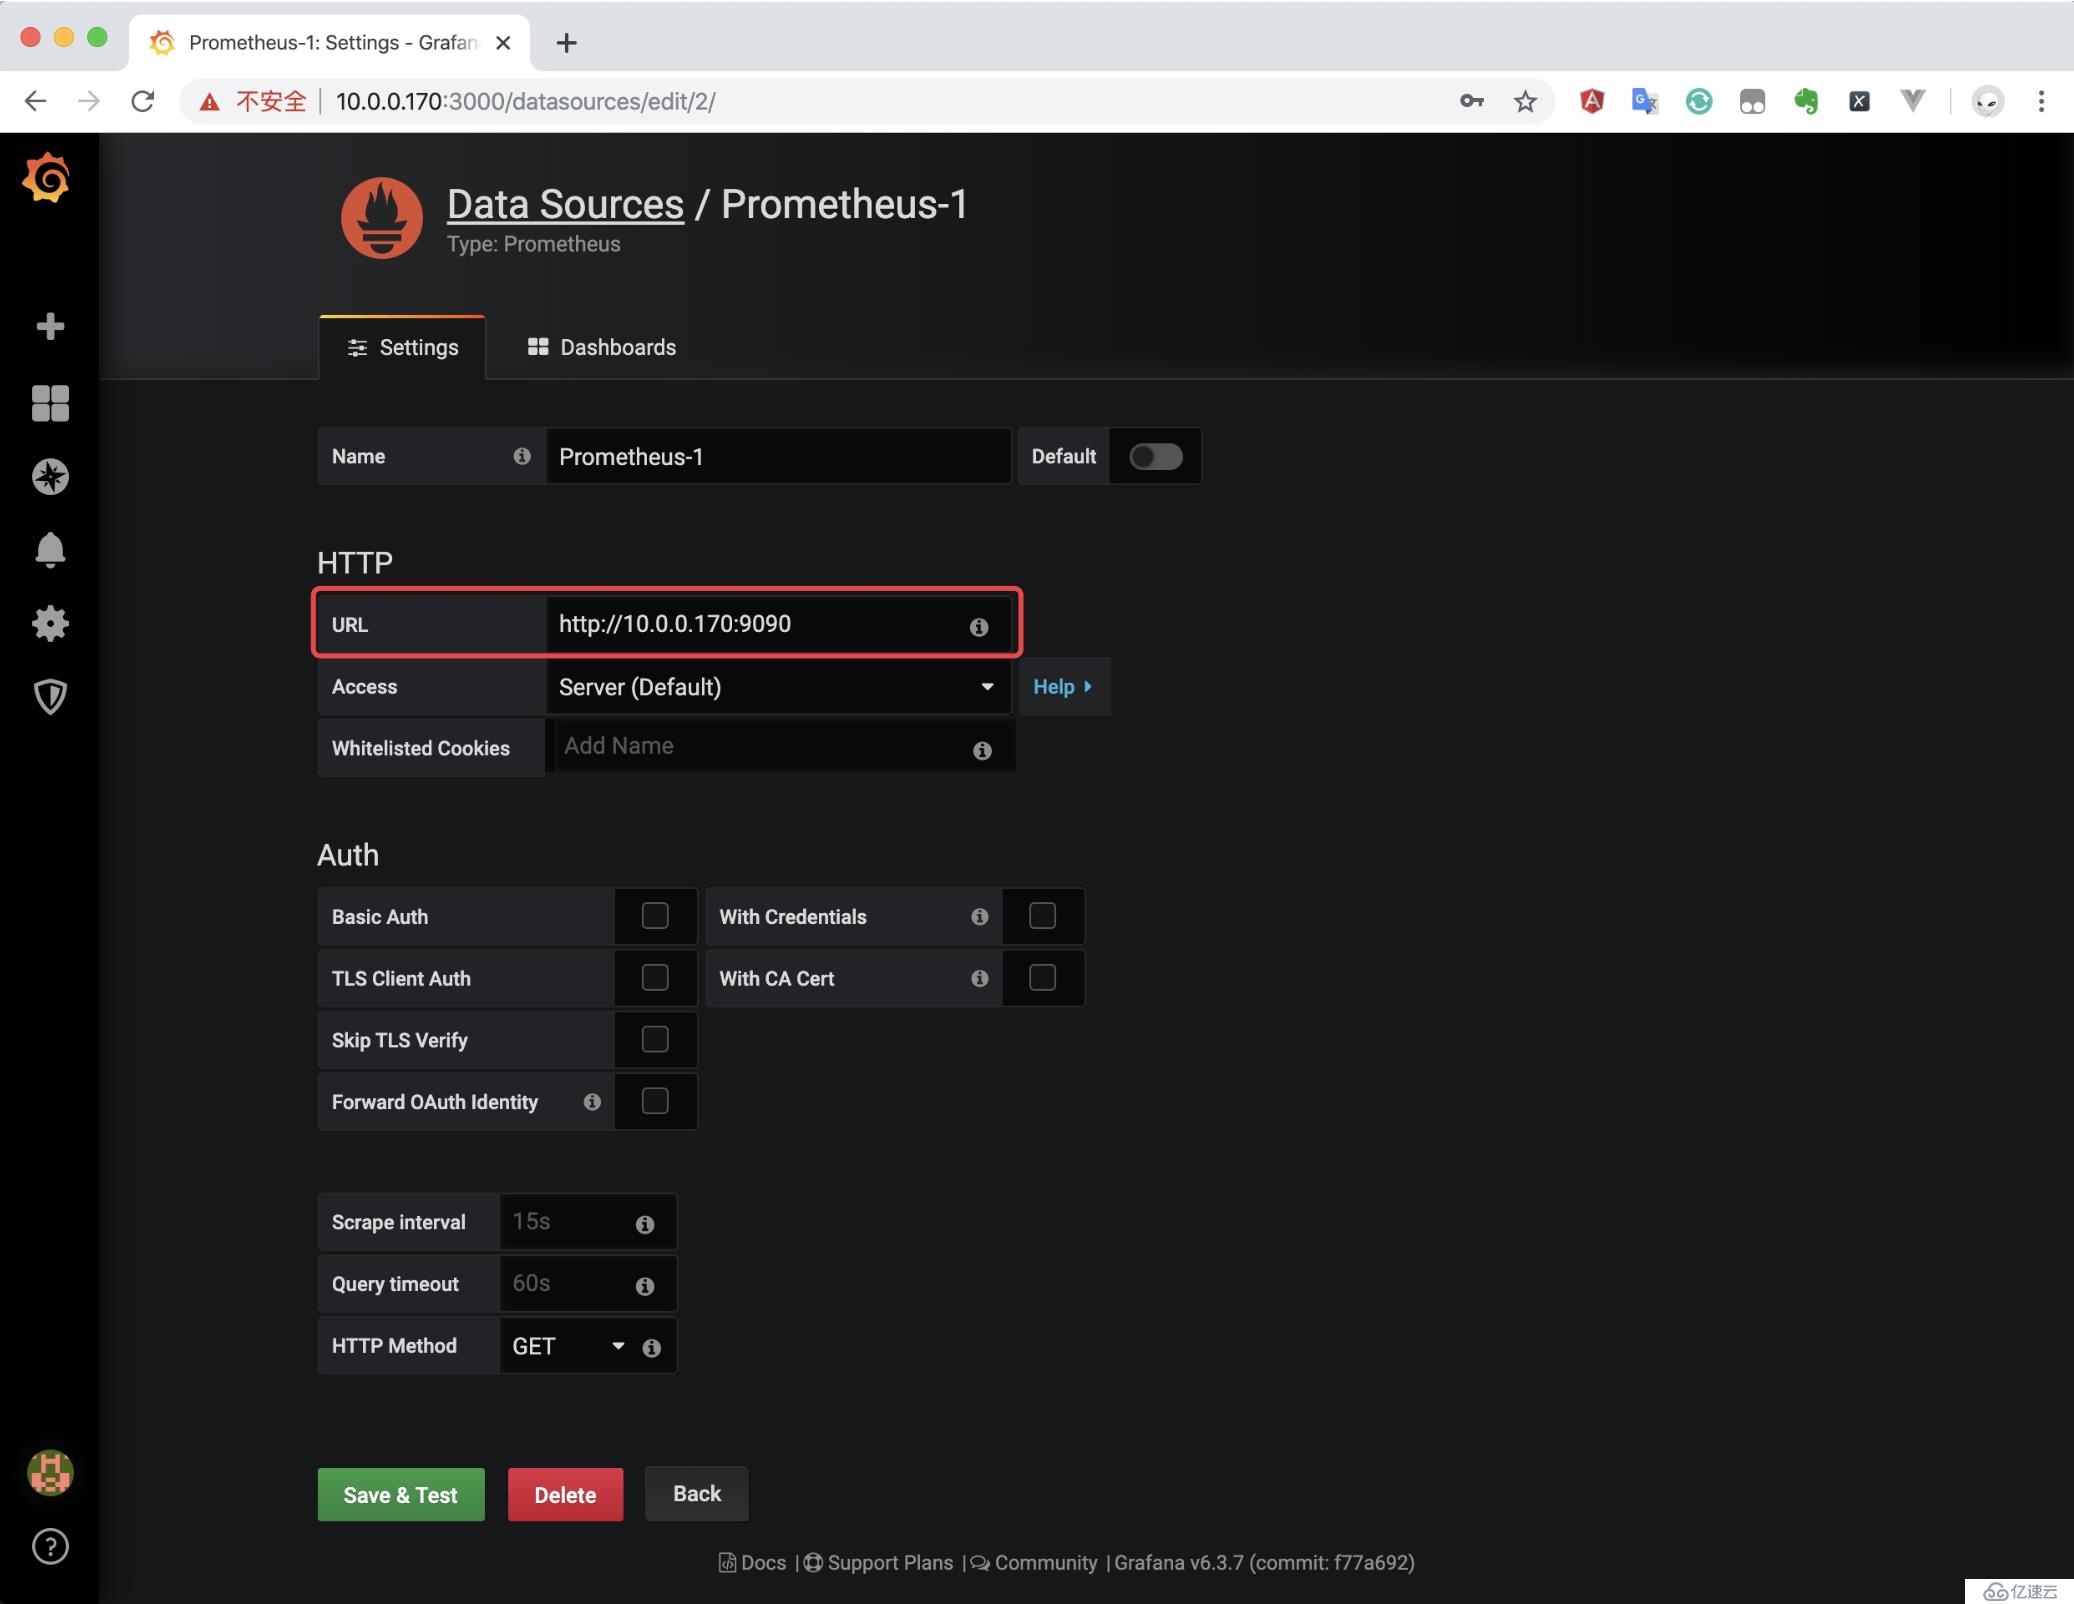
(4)Settings页面填写Prometheus地址并保存
(5)切换到我们刚才添加的Prometheus 2.0 Stats即可看到整个监控页面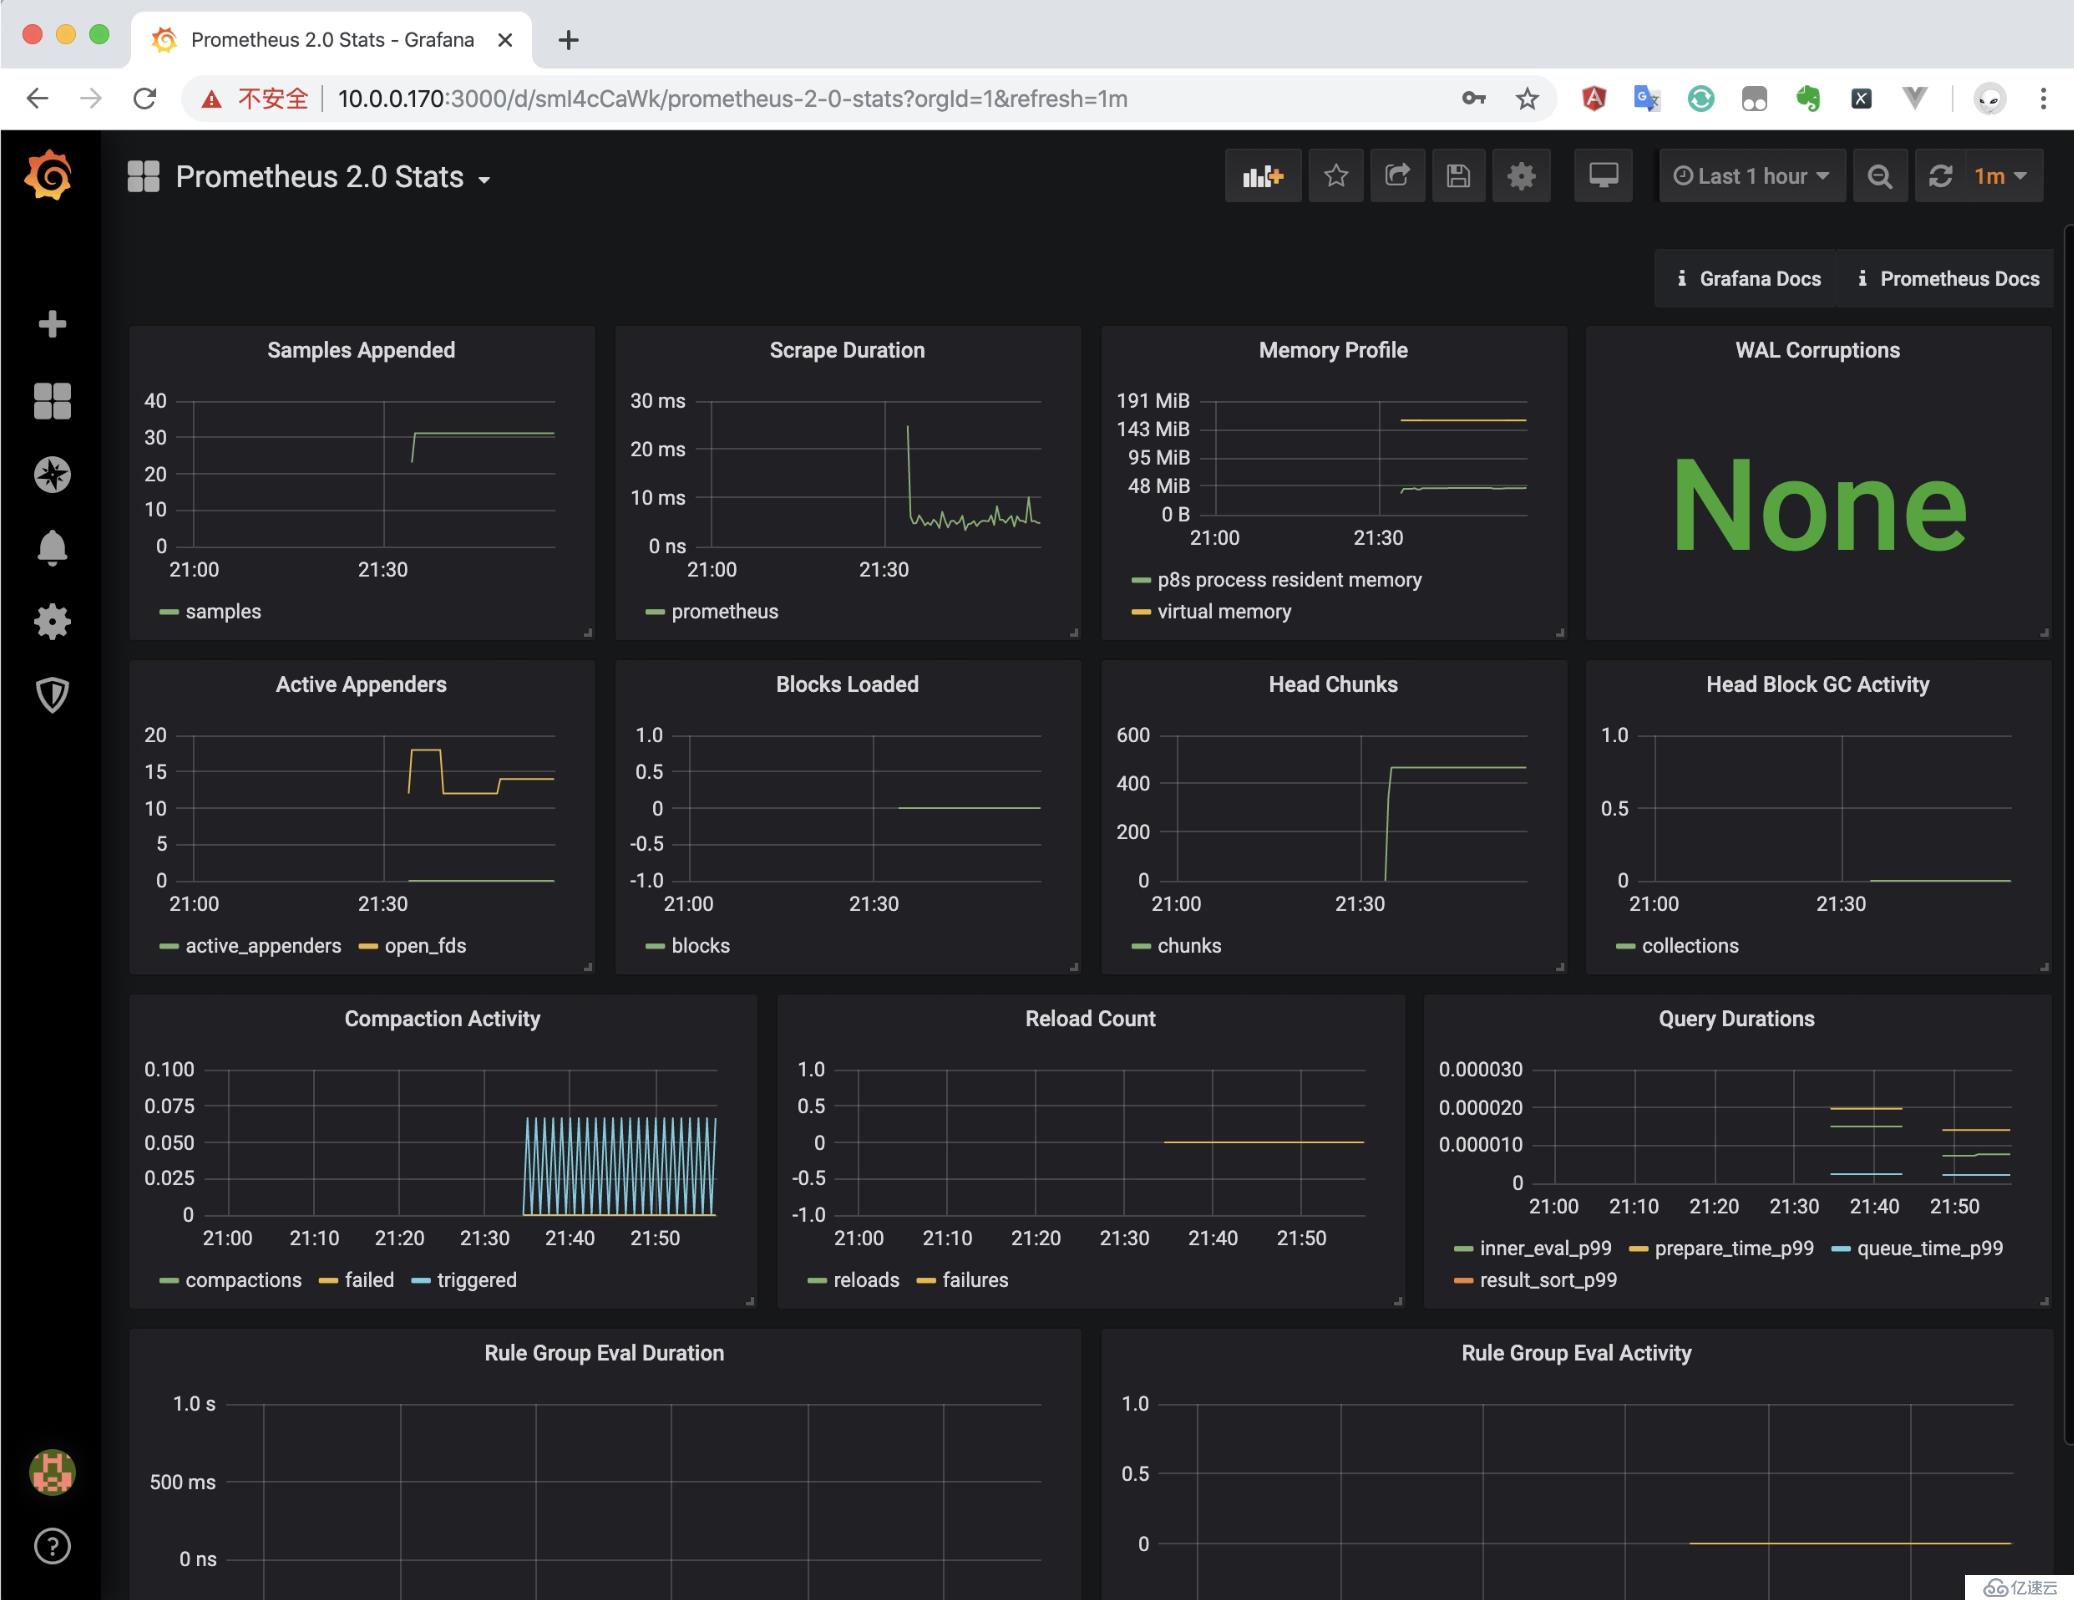
那么现在Prometheus是没有任何监控数据的,
5、Node-Exporter部署
需要监控服务器CPU、内存、磁盘、I/O等信息,首先需要安装node_exporter。node_exporter的作用是用于机器系统数据收集。
下载地址:
https://github.com/prometheus/node_exporter/releases/
https://prometheus.io/download/
1.安装node_exporter
$ tar xf node_exporter-0.18.1.linux-amd64.tar.gz -C /usr/local/
$ ln -s  /usr/local/node_exporter-0.18.1.linux-amd64/ /usr/local/node_exporter
创建system服务
$ vim /etc/systemd/system/node_exporter.service
[Unit]
Description=node_exporter
After=network.target

[Service]
Type=simple
User=root
ExecStart=/usr/local/node_exporter/node_exporter
Restart=on-failure

[Install]
WantedBy=multi-user.target
2.启动node-exporter
$ systemctl daemon-reload
$ systemctl start node_exporter.service
$ systemctl enable node_exporter.service

// Node Exporter默认端口 - 9100
$ netstat -lntup | grep "9100"
tcp6       0      0 :::9100                 :::*                    LISTEN      5122/node_exporter
3.Node Exporter默认的抓取地址为http://IP:9100/metrics
$ curl http://127.0.0.1:9100/metrics
4.Prometheus配置文件添加被监控机器
// 默认node-exporter端口为9100
$ vim /usr/local/prometheus/prometheus.yml
  - job_name: 'prometheus'
    static_configs:
    - targets: ['localhost:9100']

  - job_name: 'node_exporter_centos'
    scrape_interval: 5s
    static_configs:
      - targets: ['10.0.0.171:9100']
prometheus.yml中一共定义了两个监控:一个是监控prometheus自身服务,另一个是监控Linux服务器
5.重启prometheus服务
$ systemctl restart prometheus
6.Grafana安装Node Exporter的dashboards
下载地址:https://grafana.com/grafana/dashboards/11074/revisions
(1)将下载好的.json结尾的文件在Grafana中导入,并选择对应的数据源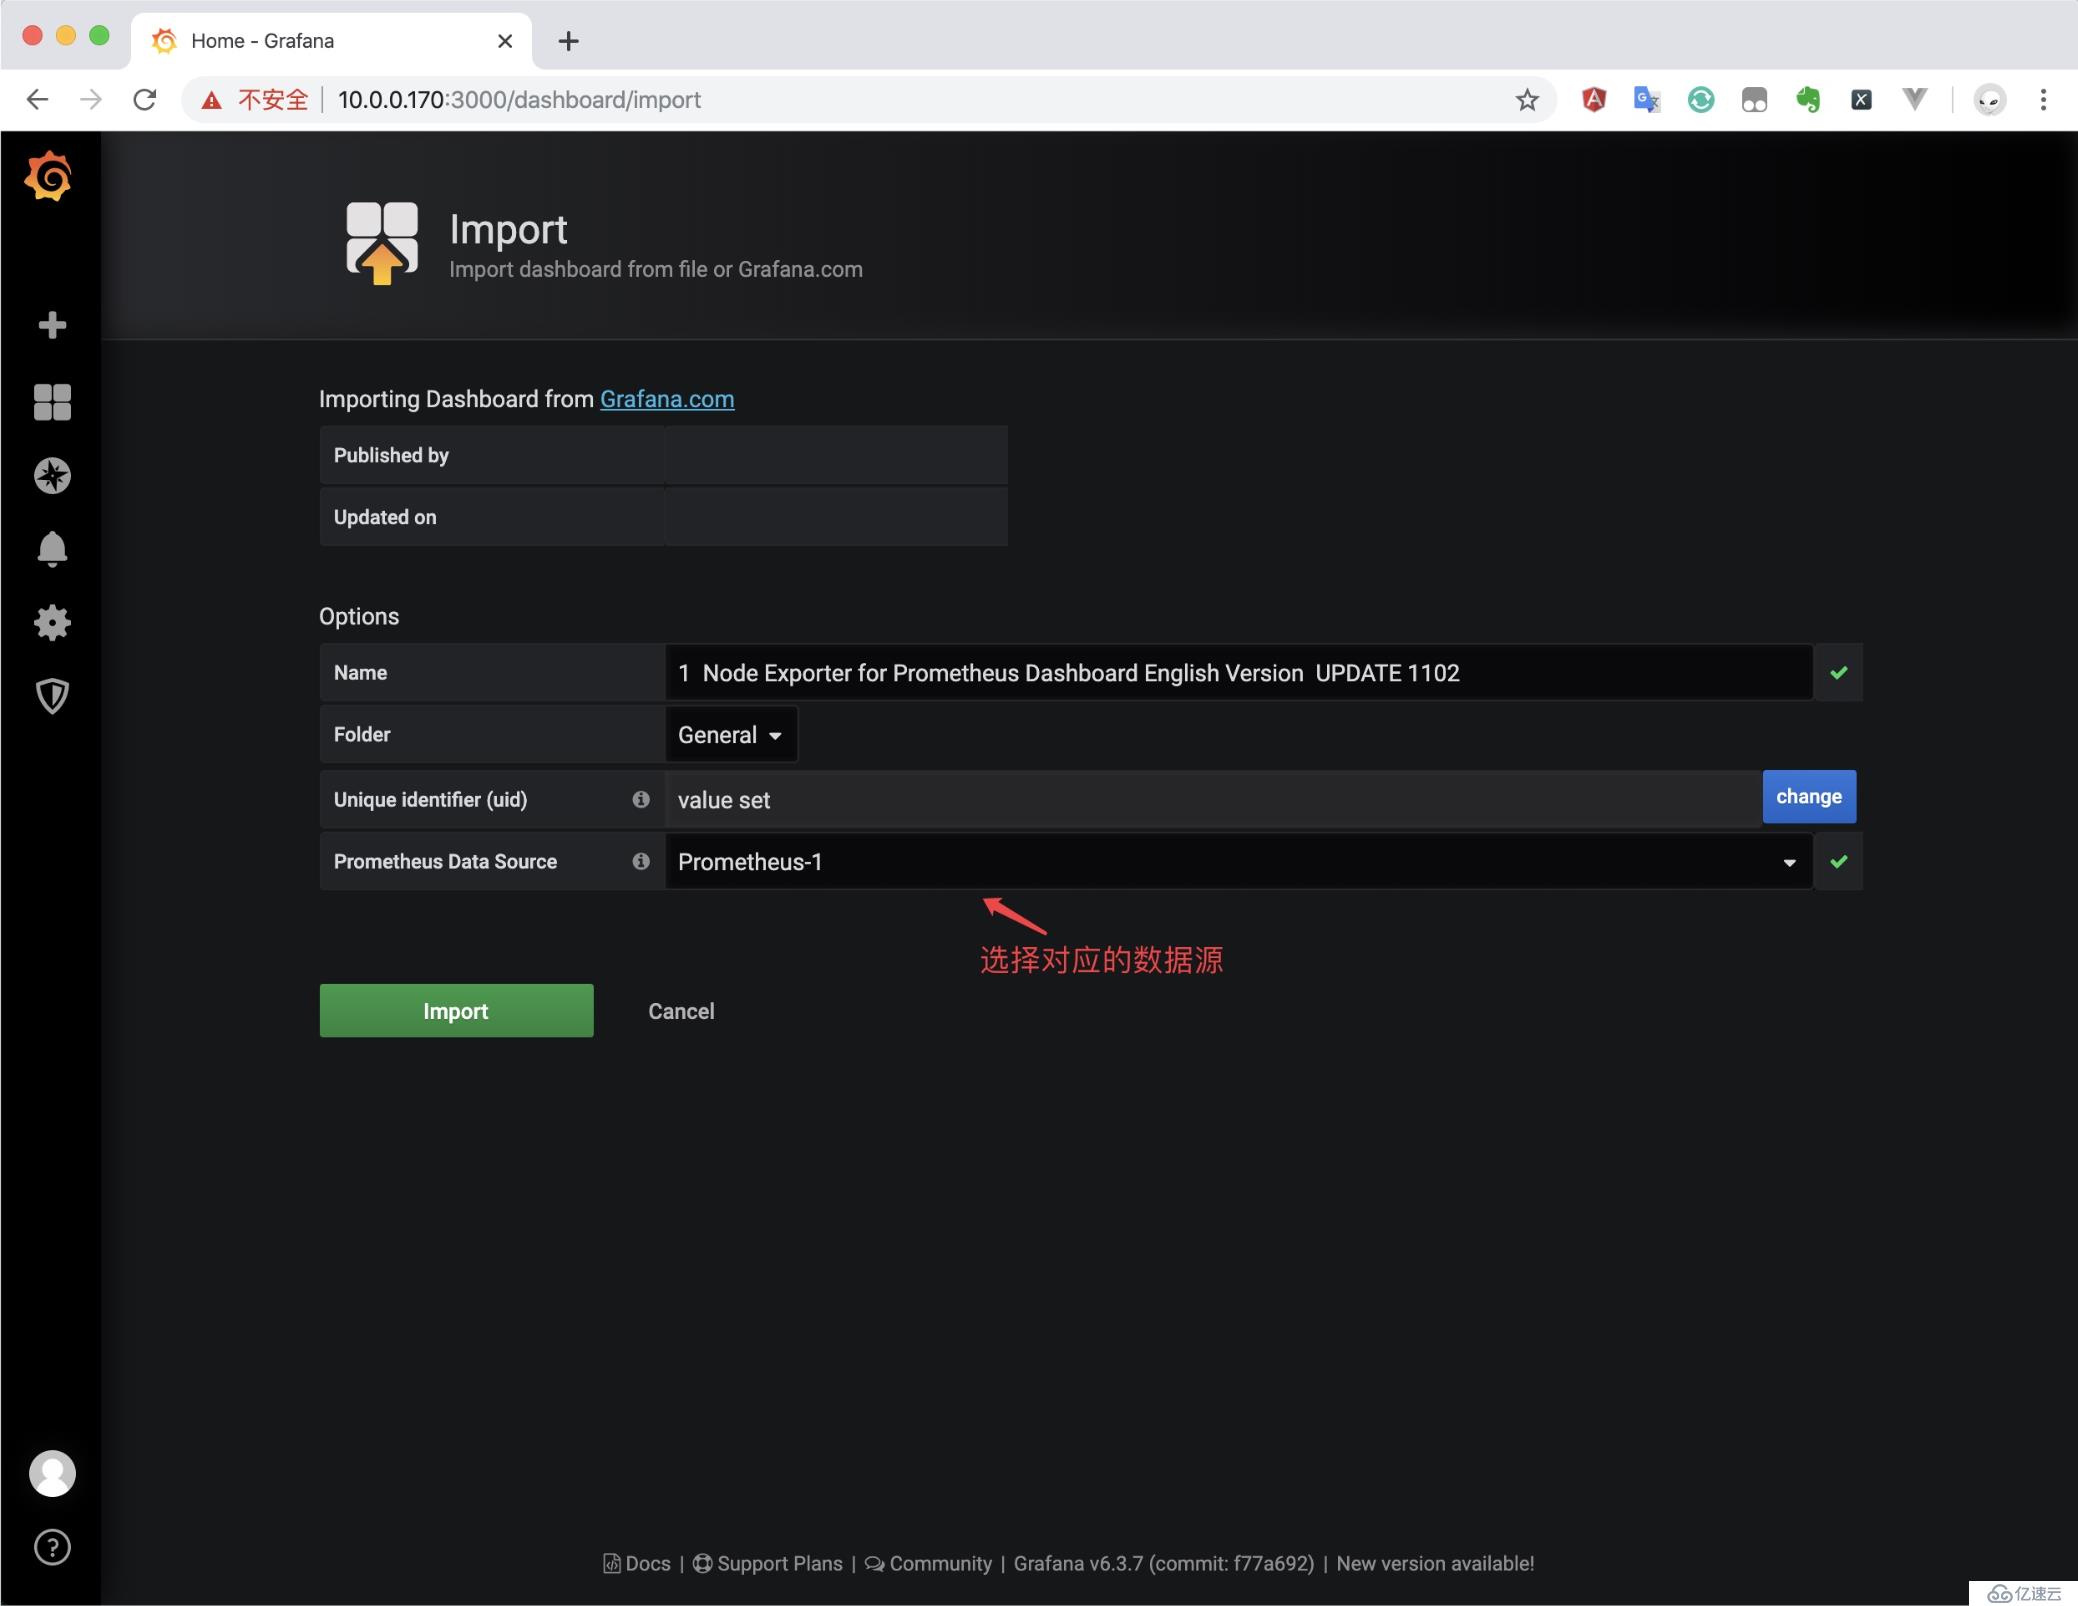
(2)通过Node Exporter的dashboards就可以看到很多图表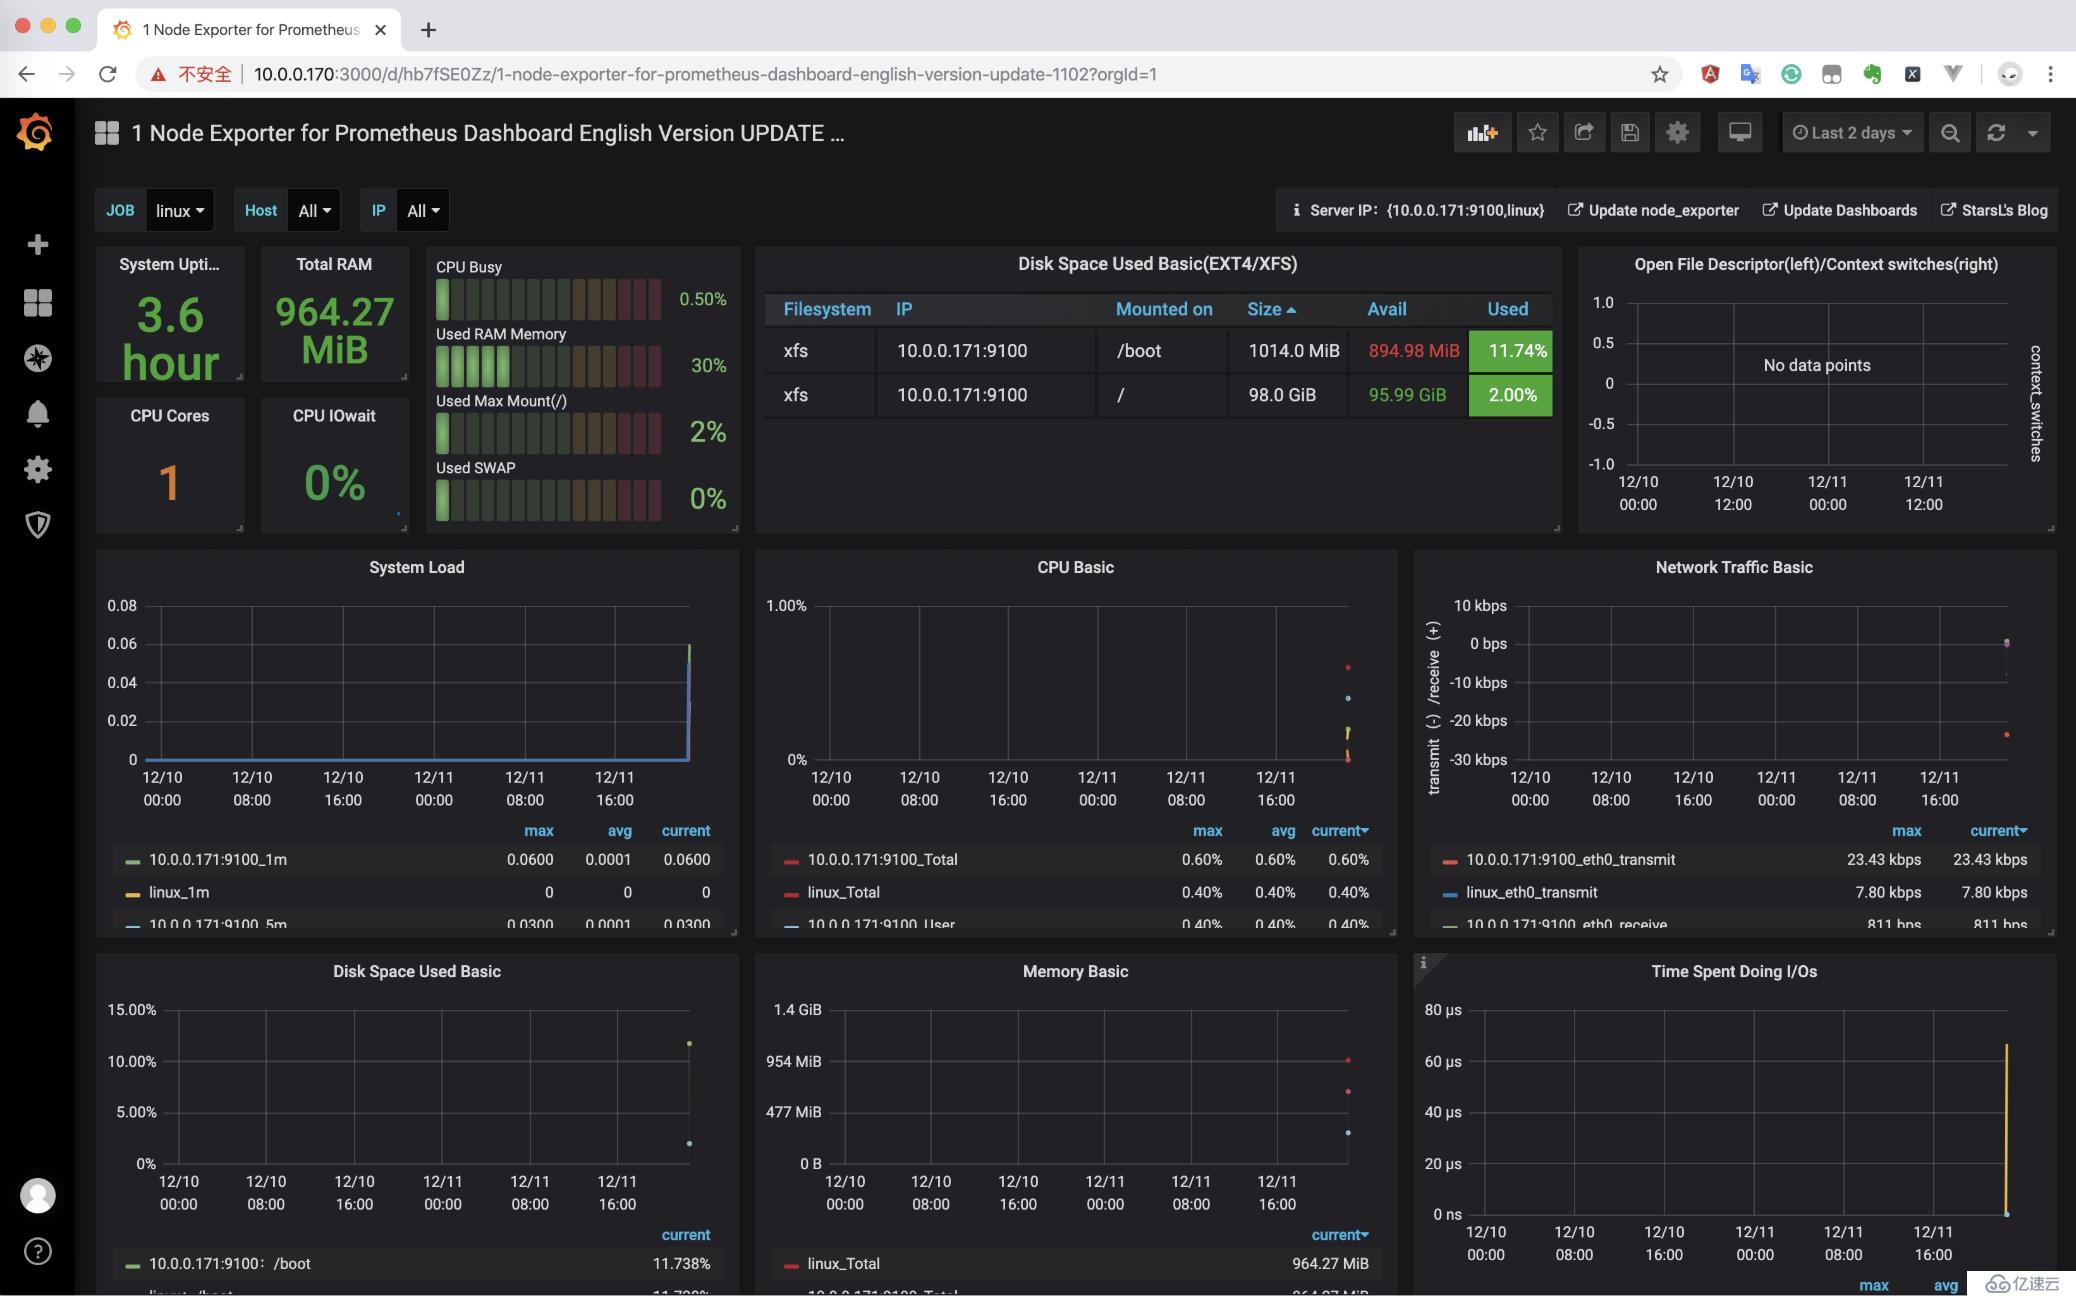
上述内容就是如何入门Prometheus,你们学到知识或技能了吗?如果还想学到更多技能或者丰富自己的知识储备,欢迎关注亿速云行业资讯频道。
免责声明:本站发布的内容(图片、视频和文字)以原创、转载和分享为主,文章观点不代表本网站立场,如果涉及侵权请联系站长邮箱:is@yisu.com进行举报,并提供相关证据,一经查实,将立刻删除涉嫌侵权内容。