您好,登录后才能下订单哦!
密码登录
登录注册
点击 登录注册 即表示同意《亿速云用户服务条款》
本文介绍了python 支持向量机非线性回归SVR模型,废话不多说,具体如下:
import numpy as np
import matplotlib.pyplot as plt

from sklearn import datasets, linear_model,svm
from sklearn.model_selection import train_test_split

def load_data_regression():
  '''
  加载用于回归问题的数据集
  '''
  diabetes = datasets.load_diabetes() #使用 scikit-learn 自带的一个糖尿病病人的数据集
  # 拆分成训练集和测试集,测试集大小为原始数据集大小的 1/4
  return train_test_split(diabetes.data,diabetes.target,test_size=0.25,random_state=0)

#支持向量机非线性回归SVR模型
def test_SVR_linear(*data):
  X_train,X_test,y_train,y_test=data
  regr=svm.SVR(kernel='linear')
  regr.fit(X_train,y_train)
  print('Coefficients:%s, intercept %s'%(regr.coef_,regr.intercept_))
  print('Score: %.2f' % regr.score(X_test, y_test))

# 生成用于回归问题的数据集
X_train,X_test,y_train,y_test=load_data_regression()
# 调用 test_LinearSVR
test_SVR_linear(X_train,X_test,y_train,y_test)

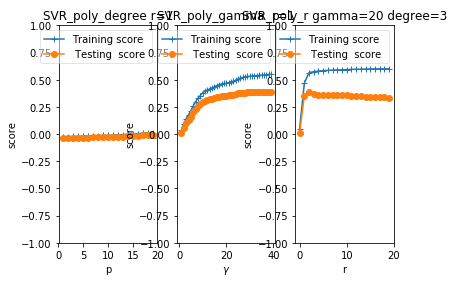
def test_SVR_poly(*data):
  '''
  测试 多项式核的 SVR 的预测性能随 degree、gamma、coef0 的影响.
  '''
  X_train,X_test,y_train,y_test=data
  fig=plt.figure()
  ### 测试 degree ####
  degrees=range(1,20)
  train_scores=[]
  test_scores=[]
  for degree in degrees:
    regr=svm.SVR(kernel='poly',degree=degree,coef0=1)
    regr.fit(X_train,y_train)
    train_scores.append(regr.score(X_train,y_train))
    test_scores.append(regr.score(X_test, y_test))
  ax=fig.add_subplot(1,3,1)
  ax.plot(degrees,train_scores,label="Training score ",marker='+' )
  ax.plot(degrees,test_scores,label= " Testing score ",marker='o' )
  ax.set_title( "SVR_poly_degree r=1")
  ax.set_xlabel("p")
  ax.set_ylabel("score")
  ax.set_ylim(-1,1.)
  ax.legend(loc="best",framealpha=0.5)

  ### 测试 gamma,固定 degree为3, coef0 为 1 ####
  gammas=range(1,40)
  train_scores=[]
  test_scores=[]
  for gamma in gammas:
    regr=svm.SVR(kernel='poly',gamma=gamma,degree=3,coef0=1)
    regr.fit(X_train,y_train)
    train_scores.append(regr.score(X_train,y_train))
    test_scores.append(regr.score(X_test, y_test))
  ax=fig.add_subplot(1,3,2)
  ax.plot(gammas,train_scores,label="Training score ",marker='+' )
  ax.plot(gammas,test_scores,label= " Testing score ",marker='o' )
  ax.set_title( "SVR_poly_gamma r=1")
  ax.set_xlabel(r"$\gamma$")
  ax.set_ylabel("score")
  ax.set_ylim(-1,1)
  ax.legend(loc="best",framealpha=0.5)
  ### 测试 r,固定 gamma 为 20,degree为 3 ######
  rs=range(0,20)
  train_scores=[]
  test_scores=[]
  for r in rs:
    regr=svm.SVR(kernel='poly',gamma=20,degree=3,coef0=r)
    regr.fit(X_train,y_train)
    train_scores.append(regr.score(X_train,y_train))
    test_scores.append(regr.score(X_test, y_test))
  ax=fig.add_subplot(1,3,3)
  ax.plot(rs,train_scores,label="Training score ",marker='+' )
  ax.plot(rs,test_scores,label= " Testing score ",marker='o' )
  ax.set_title( "SVR_poly_r gamma=20 degree=3")
  ax.set_xlabel(r"r")
  ax.set_ylabel("score")
  ax.set_ylim(-1,1.)
  ax.legend(loc="best",framealpha=0.5)
  plt.show()

# 调用 test_SVR_poly
test_SVR_poly(X_train,X_test,y_train,y_test)

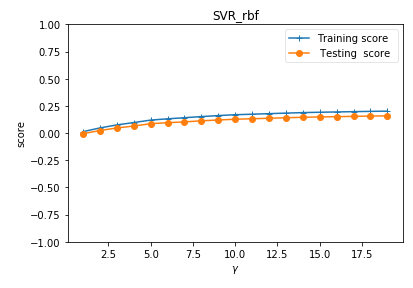
def test_SVR_rbf(*data):
  '''
  测试 高斯核的 SVR 的预测性能随 gamma 参数的影响
  '''
  X_train,X_test,y_train,y_test=data
  gammas=range(1,20)
  train_scores=[]
  test_scores=[]
  for gamma in gammas:
    regr=svm.SVR(kernel='rbf',gamma=gamma)
    regr.fit(X_train,y_train)
    train_scores.append(regr.score(X_train,y_train))
    test_scores.append(regr.score(X_test, y_test))
  fig=plt.figure()
  ax=fig.add_subplot(1,1,1)
  ax.plot(gammas,train_scores,label="Training score ",marker='+' )
  ax.plot(gammas,test_scores,label= " Testing score ",marker='o' )
  ax.set_title( "SVR_rbf")
  ax.set_xlabel(r"$\gamma$")
  ax.set_ylabel("score")
  ax.set_ylim(-1,1)
  ax.legend(loc="best",framealpha=0.5)
  plt.show()

# 调用 test_SVR_rbf
test_SVR_rbf(X_train,X_test,y_train,y_test)

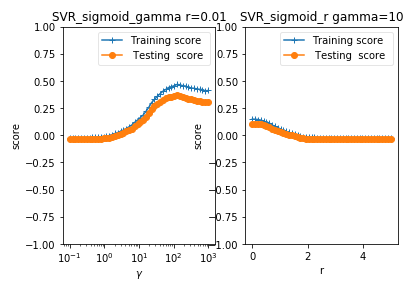
def test_SVR_sigmoid(*data):
  '''
  测试 sigmoid 核的 SVR 的预测性能随 gamma、coef0 的影响.
  '''
  X_train,X_test,y_train,y_test=data
  fig=plt.figure()

  ### 测试 gammam,固定 coef0 为 0.01 ####
  gammas=np.logspace(-1,3)
  train_scores=[]
  test_scores=[]

  for gamma in gammas:
    regr=svm.SVR(kernel='sigmoid',gamma=gamma,coef0=0.01)
    regr.fit(X_train,y_train)
    train_scores.append(regr.score(X_train,y_train))
    test_scores.append(regr.score(X_test, y_test))
  ax=fig.add_subplot(1,2,1)
  ax.plot(gammas,train_scores,label="Training score ",marker='+' )
  ax.plot(gammas,test_scores,label= " Testing score ",marker='o' )
  ax.set_title( "SVR_sigmoid_gamma r=0.01")
  ax.set_xscale("log")
  ax.set_xlabel(r"$\gamma$")
  ax.set_ylabel("score")
  ax.set_ylim(-1,1)
  ax.legend(loc="best",framealpha=0.5)
  ### 测试 r ,固定 gamma 为 10 ######
  rs=np.linspace(0,5)
  train_scores=[]
  test_scores=[]

  for r in rs:
    regr=svm.SVR(kernel='sigmoid',coef0=r,gamma=10)
    regr.fit(X_train,y_train)
    train_scores.append(regr.score(X_train,y_train))
    test_scores.append(regr.score(X_test, y_test))
  ax=fig.add_subplot(1,2,2)
  ax.plot(rs,train_scores,label="Training score ",marker='+' )
  ax.plot(rs,test_scores,label= " Testing score ",marker='o' )
  ax.set_title( "SVR_sigmoid_r gamma=10")
  ax.set_xlabel(r"r")
  ax.set_ylabel("score")
  ax.set_ylim(-1,1)
  ax.legend(loc="best",framealpha=0.5)
  plt.show()

# 调用 test_SVR_sigmoid
test_SVR_sigmoid(X_train,X_test,y_train,y_test)

以上就是本文的全部内容,希望对大家的学习有所帮助,也希望大家多多支持亿速云。
免责声明:本站发布的内容(图片、视频和文字)以原创、转载和分享为主,文章观点不代表本网站立场,如果涉及侵权请联系站长邮箱:is@yisu.com进行举报,并提供相关证据,一经查实,将立刻删除涉嫌侵权内容。