您好,登录后才能下订单哦!
密码登录
登录注册
点击 登录注册 即表示同意《亿速云用户服务条款》
这篇文章将为大家详细讲解有关Kubernetes-dashboard+Heapster+InfluxDB+Grafana的示例分析,小编觉得挺实用的,因此分享给大家做个参考,希望大家阅读完这篇文章后可以有所收获。
一:前言
1.kubernetes-dashboard 官方提供的用户管理Kubernets集群可视化工具
2.cAdvisor是用于监控容器运行状态的利器之一。在kubernetes系统中,cAdvisor已经被默认集成到了kubelet组件内,当kubelet服务启动时,它会自动启动cAdvisor服务,然后cAdvisor会实时采集所在节点的性能指标及节点上运行的容器的性能指标。cAdvisor主页显示了主机的实时运行状态,包括CPU使用情况、内存使用情况、网络吞吐量及文件系统使用情况等信息。但是cAdvisor只提供了单机的容器资源占用情况,而在大规模容器集群中,需要对所有的Node和全部容器进行性能监控。这就需要一套工具来实现集群性能数据的采集、存储和展示。
3.Heapster 提供整个集群的资源监控,并支持持久化数据存储到InfluxDB或者其他的存储后端。Heapster从kubelet提供的API采集节点和容器的资源占用。另外,Heapster的 /metrics API提供了Prometheus格式的数据。
4.InfluxDB是一个开源分布式时序、事件和指标数据库。
5.Grafana是一个开源仪表盘工具,它可用于Graphite、InfluxDB与 OpenTSDB 一起使用。最新的版本还可以用于其他的数据源,比如Elasticsearch。(与heapster与Prometheus均可集成)
6.Zabbix是一个基于WEB界面的提供分布式系统监视以及网络监视功能的企业级的开源解决方案.多用于传统(非微服务)分布式系统的监控。
7.Prometheus 容器时代的产物。集成采集、存储(支持多种时序数据库)、页面展示与一体的监控工具。
监控方案:
a.Heapster+InfluxDB+Grafana
b.Prometheus
二:安装
1.镜像
k8s.gcr.io/kubernetes-dashboard-amd64:v1.8.2
gcr.io/google_containers/heapster-amd64:v1.4.2
gcr.io/google_containers/heapster-influxdb-amd64:v1.3.3
gcr.io/google_containers/heapster-grafana-amd64:v4.4.3
2.yaml文件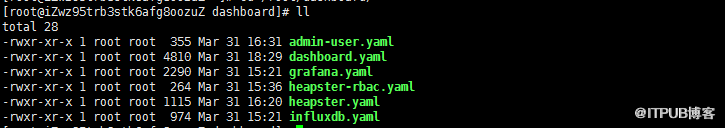
admin-user.yaml(不需修改)
点击(此处)折叠或打开
apiVersion: v1
kind: ServiceAccount
metadata:
name: admin-user
namespace: kube-system
---
apiVersion: rbac.authorization.k8s.io/v1
kind: ClusterRoleBinding
metadata:
name: admin-user
roleRef:
apiGroup: rbac.authorization.k8s.io
kind: ClusterRole
name: cluster-admin
subjects:
- kind: ServiceAccount
name: admin-user
namespace: kube-system
dashboard.yaml(橙色标示是修改的地方。特别说明当前版本需要添加 - --heapster-host=http://heapster 配置,否则无法正常获取metrics )
点击(此处)折叠或打开
# Copyright 2017 The Kubernetes Authors.
#
# Licensed under the Apache License, Version 2.0 (the "License");
# you may not use this file except in compliance with the License.
# You may obtain a copy of the License at
#
# http://www.apache.org/licenses/LICENSE-2.0
#
# Unless required by applicable law or agreed to in writing, software
# distributed under the License is distributed on an "AS IS" BASIS,
# WITHOUT WARRANTIES OR CONDITIONS OF ANY KIND, either express or implied.
# See the License for the specific language governing permissions and
# limitations under the License.
# Configuration to deploy release version of the Dashboard UI compatible with
# Kubernetes 1.8.
#
# Example usage: kubectl create -f
# ------------------- Dashboard Secret ------------------- #
apiVersion: v1
kind: Secret
metadata:
labels:
k8s-app: kubernetes-dashboard
name: kubernetes-dashboard-certs
namespace: kube-system
type: Opaque
---
# ------------------- Dashboard Service Account ------------------- #
apiVersion: v1
kind: ServiceAccount
metadata:
labels:
k8s-app: kubernetes-dashboard
name: kubernetes-dashboard
namespace: kube-system
---
# ------------------- Dashboard Role & Role Binding ------------------- #
kind: Role
apiVersion: rbac.authorization.k8s.io/v1
metadata:
name: kubernetes-dashboard-minimal
namespace: kube-system
rules:
# Allow Dashboard to create 'kubernetes-dashboard-key-holder' secret.
- apiGroups: [""]
resources: ["secrets"]
verbs: ["create"]
# Allow Dashboard to create 'kubernetes-dashboard-settings' config map.
- apiGroups: [""]
resources: ["configmaps"]
verbs: ["create"]
# Allow Dashboard to get, update and delete Dashboard exclusive secrets.
- apiGroups: [""]
resources: ["secrets"]
resourceNames: ["kubernetes-dashboard-key-holder", "kubernetes-dashboard-certs"]
verbs: ["get", "update", "delete"]
# Allow Dashboard to get and update 'kubernetes-dashboard-settings' config map.
- apiGroups: [""]
resources: ["configmaps"]
resourceNames: ["kubernetes-dashboard-settings"]
verbs: ["get", "update"]
# Allow Dashboard to get metrics from heapster.
- apiGroups: [""]
resources: ["services"]
resourceNames: ["heapster"]
verbs: ["proxy"]
- apiGroups: [""]
resources: ["services/proxy"]
resourceNames: ["heapster", "http:heapster:", "https:heapster:"]
verbs: ["get"]
---
apiVersion: rbac.authorization.k8s.io/v1
kind: RoleBinding
metadata:
name: kubernetes-dashboard-minimal
namespace: kube-system
roleRef:
apiGroup: rbac.authorization.k8s.io
kind: Role
name: kubernetes-dashboard-minimal
subjects:
- kind: ServiceAccount
name: kubernetes-dashboard
namespace: kube-system
---
# ------------------- Dashboard Deployment ------------------- #
kind: Deployment
apiVersion: apps/v1beta2
metadata:
labels:
k8s-app: kubernetes-dashboard
name: kubernetes-dashboard
namespace: kube-system
spec:
replicas: 1
revisionHistoryLimit: 10
selector:
matchLabels:
k8s-app: kubernetes-dashboard
template:
metadata:
labels:
k8s-app: kubernetes-dashboard
spec:
containers:
- name: kubernetes-dashboard
image: k8s.gcr.io/kubernetes-dashboard-amd64:v1.8.2
ports:
- containerPort: 8443
protocol: TCP
args:
- --auto-generate-certificates
# Uncomment the following line to manually specify Kubernetes API server Host
# If not specified, Dashboard will attempt to auto discover the API server and connect
# to it. Uncomment only if the default does not work.
# - --apiserver-host=http://my-address:port
- --heapster-host=http://heapster
volumeMounts:
- name: kubernetes-dashboard-certs
mountPath: /certs
# Create on-disk volume to store exec logs
- mountPath: /tmp
name: tmp-volume
livenessProbe:
httpGet:
scheme: HTTPS
path: /
port: 8443
initialDelaySeconds: 30
timeoutSeconds: 30
volumes:
- name: kubernetes-dashboard-certs
secret:
secretName: kubernetes-dashboard-certs
- name: tmp-volume
emptyDir: {}
serviceAccountName: kubernetes-dashboard
# Comment the following tolerations if Dashboard must not be deployed on master
tolerations:
- key: node-role.kubernetes.io/master
effect: NoSchedule
---
# ------------------- Dashboard Service ------------------- #
kind: Service
apiVersion: v1
metadata:
labels:
k8s-app: kubernetes-dashboard
name: kubernetes-dashboard
namespace: kube-system
spec:
type: NodePort
ports:
- port: 443
targetPort: 8443
nodePort: 32666
selector:
k8s-app: kubernetes-dashboard
grafana.yaml(橙色标示为需要修改的地方)
点击(此处)折叠或打开
apiVersion: extensions/v1beta1
kind: Deployment
metadata:
name: monitoring-grafana
namespace: kube-system
spec:
replicas: 1
template:
metadata:
labels:
task: monitoring
k8s-app: grafana
spec:
containers:
- name: grafana
image: gcr.io/google_containers/heapster-grafana-amd64:v4.4.3
ports:
- containerPort: 3000
protocol: TCP
volumeMounts:
- mountPath: /etc/ssl/certs
name: ca-certificates
readOnly: true
- mountPath: /var
name: grafana-storage
env:
- name: INFLUXDB_HOST
value: monitoring-influxdb
- name: GF_SERVER_HTTP_PORT
value: "3000"
# The following env variables are required to make Grafana accessible via
# the kubernetes api-server proxy. On production clusters, we recommend
# removing these env variables, setup auth for grafana, and expose the grafana
# service using a LoadBalancer or a public IP.
- name: GF_AUTH_BASIC_ENABLED
value: "false"
- name: GF_AUTH_ANONYMOUS_ENABLED
value: "true"
- name: GF_AUTH_ANONYMOUS_ORG_ROLE
value: Admin
- name: GF_SERVER_ROOT_URL
# If you're only using the API Server proxy, set this value instead:
# value: /api/v1/namespaces/kube-system/services/monitoring-grafana/proxy
value: /
volumes:
- name: ca-certificates
hostPath:
path: /etc/ssl/certs
- name: grafana-storage
emptyDir: {}
---
apiVersion: v1
kind: Service
metadata:
labels:
# For use as a Cluster add-on (https://github.com/kubernetes/kubernetes/tree/master/cluster/addons)
# If you are NOT using this as an addon, you should comment out this line.
kubernetes.io/cluster-service: 'true
heapster-rbac.yaml(不需要修改)
点击(此处)折叠或打开
kind: ClusterRoleBinding
apiVersion: rbac.authorization.k8s.io/v1beta1
metadata:
name: heapster
roleRef:
apiGroup: rbac.authorization.k8s.io
kind: ClusterRole
name: system:heapster
subjects:
- kind: ServiceAccount
name: heapster
namespace: kube-system
heapster.yaml(橙色标示为需要修改的地方)
点击(此处)折叠或打开
apiVersion: v1
kind: ServiceAccount
metadata:
name: heapster
namespace: kube-system
---
apiVersion: extensions/v1beta1
kind: Deployment
metadata:
name: heapster
namespace: kube-system
spec:
replicas: 1
template:
metadata:
labels:
task: monitoring
k8s-app: heapster
spec:
serviceAccountName: heapster
containers:
- name: heapster
image: gcr.io/google_containers/heapster-amd64:v1.4.2
imagePullPolicy: IfNotPresent
command:
- /heapster
- --source=kubernetes:https://10.116.137.196:6443
- --sink=influxdb:http://monitoring-influxdb.kube-system.svc:8086
---
apiVersion: v1
kind: Service
metadata:
labels:
task: monitoring
# For use as a Cluster add-on (https://github.com/kubernetes/kubernetes/tree/master/cluster/addons)
# If you are NOT using this as an addon, you should comment out this line.
kubernetes.io/cluster-service: 'true'
kubernetes.io/name: Heapster
name: heapster
namespace: kube-system
spec:
ports:
- port: 80
targetPort: 8082
selector:
k8s-app: heapster
influxdb.yaml(橙色标示为需要修改的地方)
点击(此处)折叠或打开
apiVersion: extensions/v1beta1
kind: Deployment
metadata:
name: monitoring-influxdb
namespace: kube-system
spec:
replicas: 1
template:
metadata:
labels:
task: monitoring
k8s-app: influxdb
spec:
containers:
- name: influxdb
image: gcr.io/google_containers/heapster-influxdb-amd64:v1.3.3
volumeMounts:
- mountPath: /data
name: influxdb-storage
volumes:
- name: influxdb-storage
emptyDir: {}
---
apiVersion: v1
kind: Service
metadata:
labels:
task: monitoring
# For use as a Cluster add-on (https://github.com/kubernetes/kubernetes/tree/master/cluster/addons)
# If you are NOT using this as an addon, you should comment out this line.
kubernetes.io/cluster-service: 'true'
kubernetes.io/name: monitoring-influxdb
name: monitoring-influxdb
namespace: kube-system
spec:
ports:
- port: 8086
targetPort: 8086
selector:
k8s-app: influxdb
dashboard.yaml 文件源于https://raw.githubusercontent.com/kubernetes/dashboard/master/src/deploy/recommended/kubernetes-dashboard.yaml
其他yaml.文件源于
https://codeload.github.com/kubernetes/heapster/zip/v1.4.2 下载后解压缩 位于目录\deploy\kube-config\influxdb
3.创建相关资源
执行命令:
kubectl create -f admin-user.yaml -f dashboard.yaml -f grafana.yaml -f heapster-rbac.yaml -f heapster.yaml -f influxdb.yaml
查看创建状态:
kubectl get pods --all-namespaces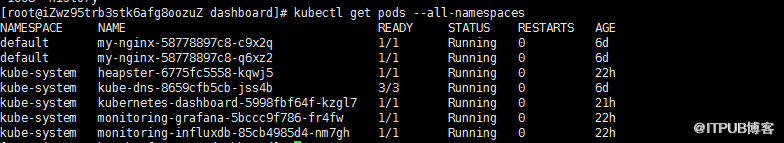
三:访问
建议使用Firefox浏览器访问https://nodeIp:32666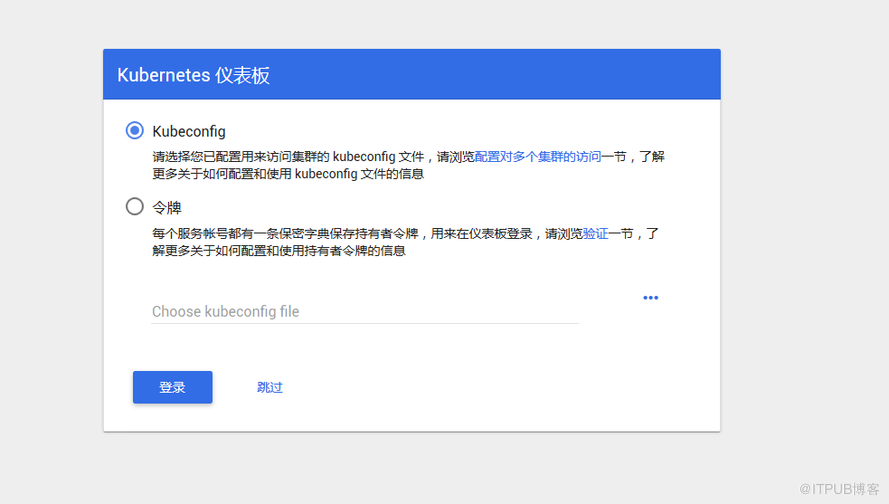
选择使用令牌登录的方式, 生成令牌的命令如下(请保存好生成的Token):
点击(此处)折叠或打开
kubectl -n kube-system describe secret $(kubectl -n kube-system get secret | grep admin-user | awk '{print $1}') | grep token
成功登录后的页面: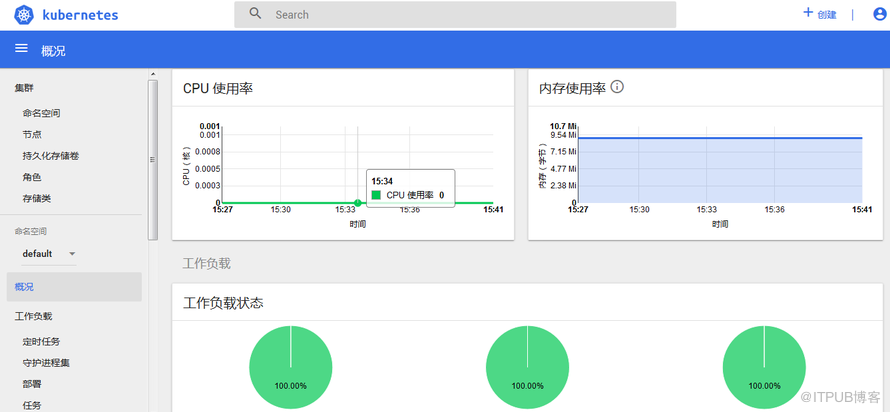
关于“Kubernetes-dashboard+Heapster+InfluxDB+Grafana的示例分析”这篇文章就分享到这里了,希望以上内容可以对大家有一定的帮助,使各位可以学到更多知识,如果觉得文章不错,请把它分享出去让更多的人看到。
免责声明:本站发布的内容(图片、视频和文字)以原创、转载和分享为主,文章观点不代表本网站立场,如果涉及侵权请联系站长邮箱:is@yisu.com进行举报,并提供相关证据,一经查实,将立刻删除涉嫌侵权内容。