您好,登录后才能下订单哦!
密码登录
登录注册
点击 登录注册 即表示同意《亿速云用户服务条款》
这篇文章主要讲解了“怎么用Python写一个电信客户流失预测模型”,文中的讲解内容简单清晰,易于学习与理解,下面请大家跟着小编的思路慢慢深入,一起来研究和学习“怎么用Python写一个电信客户流失预测模型”吧!
01、商业理解
流失客户是指那些曾经使用过产品或服务,由于对产品失去兴趣等种种原因,不再使用产品或服务的顾客。
电信服务公司、互联网服务提供商、保险公司等经常使用客户流失分析和客户流失率作为他们的关键业务指标之一,因为留住一个老客户的成本远远低于获得一个新客户。
预测分析使用客户流失预测模型,通过评估客户流失的风险倾向来预测客户流失。由于这些模型生成了一个流失概率排序名单,对于潜在的高概率流失客户,他们可以有效地实施客户保留营销计划。
下面我们就教你如何用Python写一个电信用户流失预测模型,以下是具体步骤和关键代码。
02、数据理解
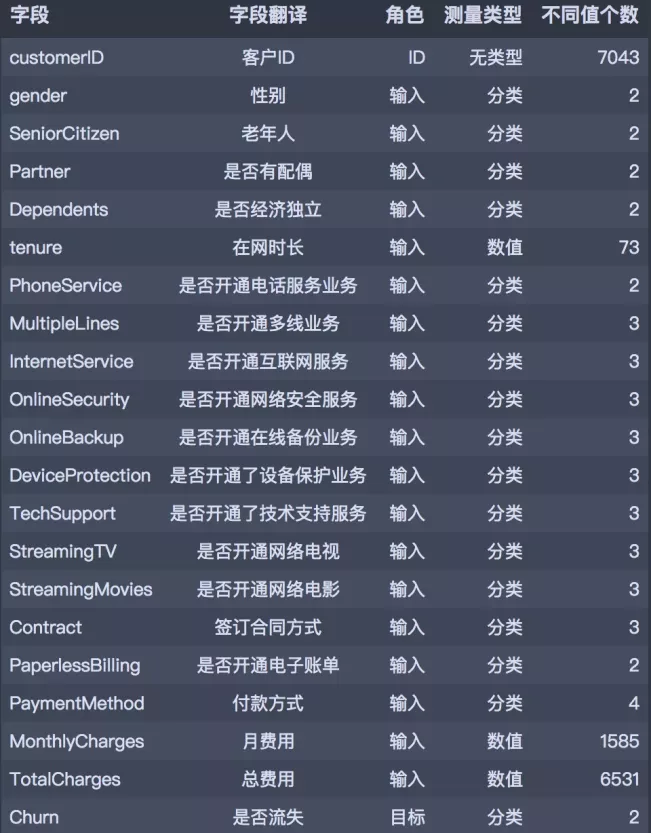
此次分析数据来自于IBM Sample Data Sets,统计自某电信公司一段时间内的消费数据。共有7043笔客户资料,每笔客户资料包含21个字段,其中1个客户ID字段,19个输入字段及1个目标字段-Churn(Yes代表流失,No代表未流失),输入字段主要包含以下三个维度指标:用户画像指标、消费产品指标、消费信息指标。字段的具体说明如下:
03、数据读入和概览
首先导入所需包。
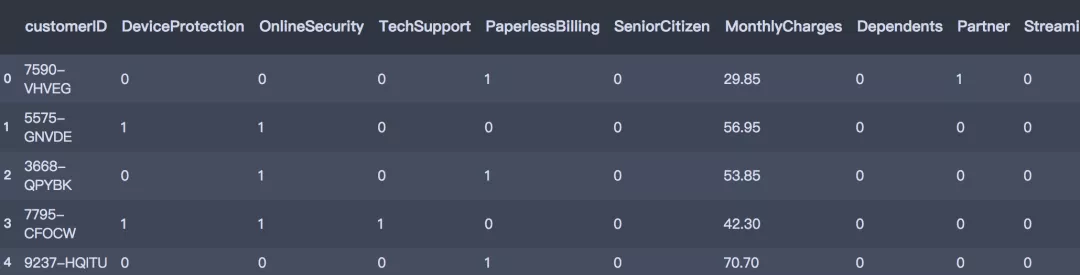
df = pd.read_csv('./Telco-Customer-Churn.csv') df.head()读入数据集
df = pd.read_csv('./Telco-Customer-Churn.csv') df.head()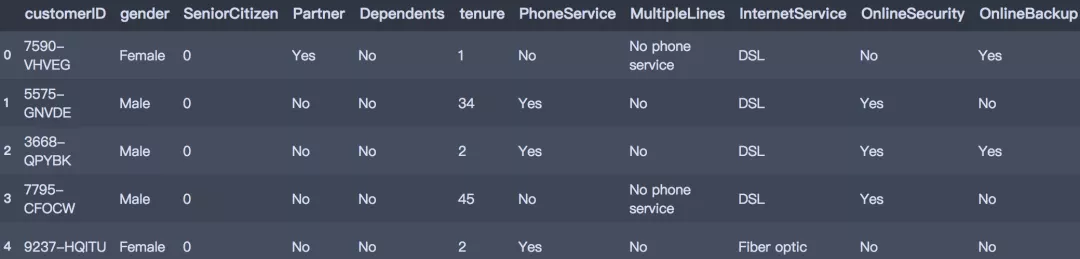
04、数据初步清洗
首先进行初步的数据清洗工作,包含错误值和异常值处理,并划分类别型和数值型字段类型,其中清洗部分包含:
OnlineSecurity、OnlineBackup、DeviceProtection、TechSupport、StreamingTV、StreamingMovies:错误值处理
TotalCharges:异常值处理
tenure:自定义分箱
定义类别型和数值型字段
# 错误值处理 repl_columns = ['OnlineSecurity', 'OnlineBackup', 'DeviceProtection', 'TechSupport','StreamingTV', 'StreamingMovies'] for i in repl_columns: df[i] = df[i].replace({'No internet service' : 'No'}) # 替换值SeniorCitizen df["SeniorCitizen"] = df["SeniorCitizen"].replace({1: "Yes", 0: "No"}) # 替换值TotalCharges df['TotalCharges'] = df['TotalCharges'].replace(' ', np.nan) # TotalCharges空值:数据量小,直接删除 df = df.dropna(subset=['TotalCharges']) df.reset_index(drop=True, inplace=True) # 重置索引 # 转换数据类型 df['TotalCharges'] = df['TotalCharges'].astype('float') # 转换tenure def transform_tenure(x): if x <= 12: return 'Tenure_1' elif x <= 24: return 'Tenure_2' elif x <= 36: return 'Tenure_3' elif x <= 48: return 'Tenure_4' elif x <= 60: return 'Tenure_5' else: return 'Tenure_over_5' df['tenure_group'] = df.tenure.apply(transform_tenure) # 数值型和类别型字段 Id_col = ['customerID'] target_col = ['Churn'] cat_cols = df.nunique()[df.nunique() < 10].index.tolist() num_cols = [i for i in df.columns if i not in cat_cols + Id_col] print('类别型字段:\n', cat_cols) print('-' * 30) print('数值型字段:\n', num_cols)类别型字段: ['gender', 'SeniorCitizen', 'Partner', 'Dependents', 'PhoneService', 'MultipleLines', 'InternetService', 'OnlineSecurity', 'OnlineBackup', 'DeviceProtection', 'TechSupport', 'StreamingTV', 'StreamingMovies', 'Contract', 'PaperlessBilling', 'PaymentMethod', 'Churn', 'tenure_group'] ------------------------------ 数值型字段: ['tenure', 'MonthlyCharges', 'TotalCharges']
05、探索性分析
对指标进行归纳梳理,分用户画像指标,消费产品指标,消费信息指标。探索影响用户流失的关键因素。
1. 目标变量Churn分布
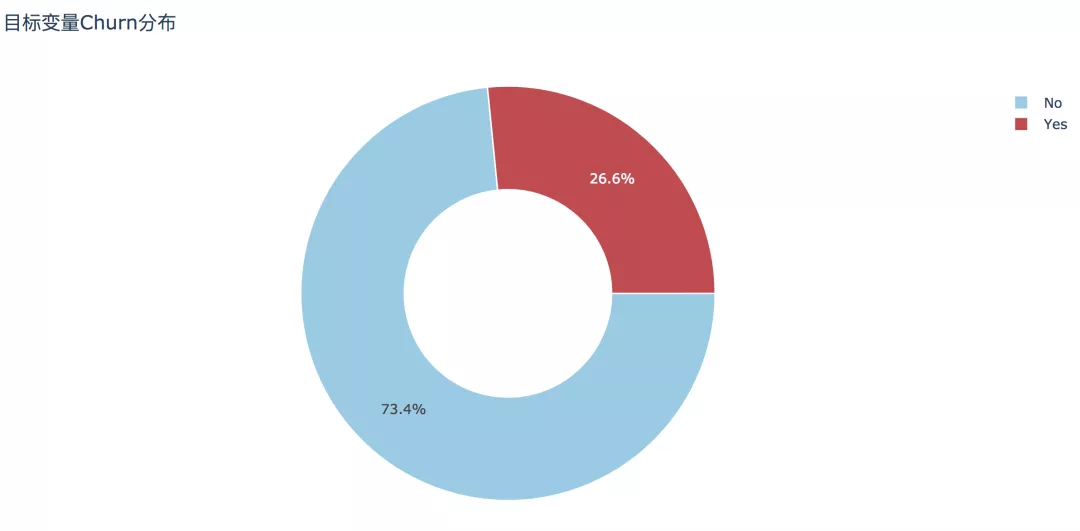
经过初步清洗之后的数据集大小为7032条记录,其中流失客户为1869条,占比26.6%,未流失客户占比73.4%。
df['Churn'].value_counts() No 5163 Yes 1869 Name: Churn, dtype: int64
trace0 = go.Pie(labels=df['Churn'].value_counts().index, values=df['Churn'].value_counts().values, hole=.5, rotation=90, marker=dict(colors=['rgb(154,203,228)', 'rgb(191,76,81)'], line=dict(color='white', width=1.3)) ) data = [trace0] layout = go.Layout(title='目标变量Churn分布') fig = go.Figure(data=data, layout=layout) py.offline.plot(fig, filename='./html/整体流失情况分布.html')
2.性别
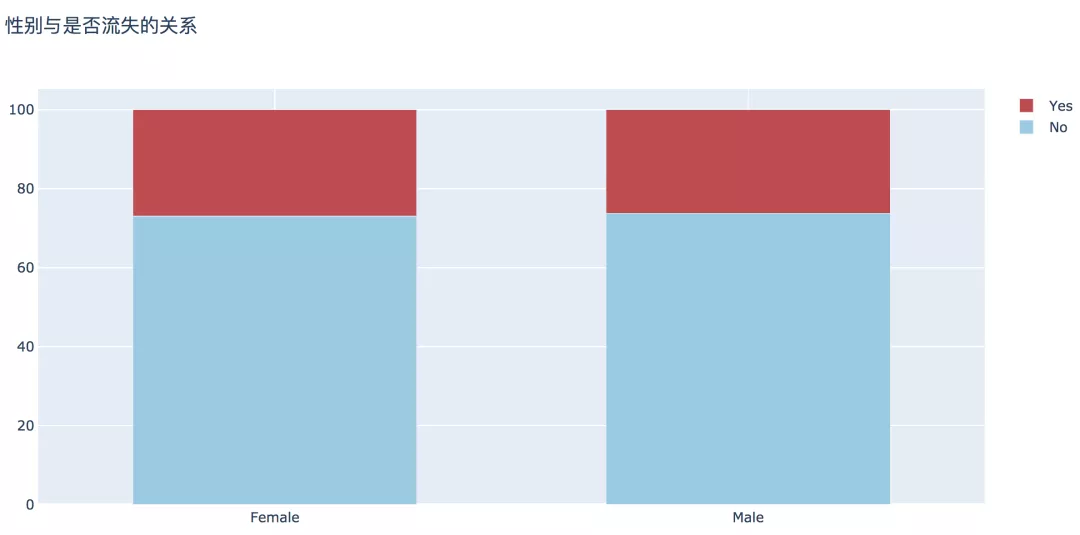
分析可见,男性和女性在客户流失比例上没有显著差异。
plot_bar(input_col='gender', target_col='Churn', title_name='性别与是否流失的关系')
3. 老年用户
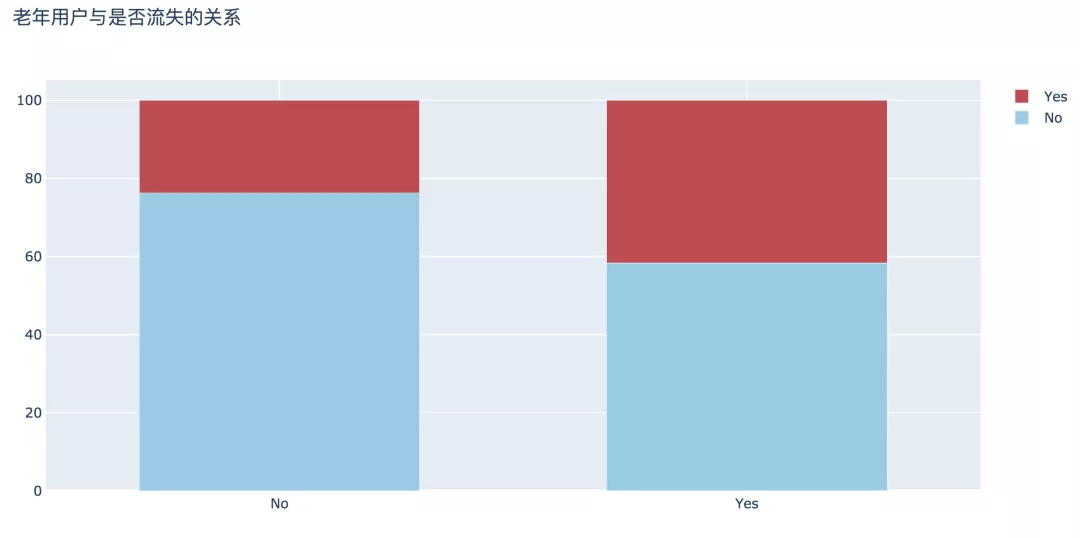
老年用户流失比例更高,为41.68%,比非老年用户高近两倍,此部分原因有待进一步探讨。
plot_bar(input_col='SeniorCitizen', target_col='Churn', title_name='老年用户与是否流失的关系')
4. 是否有配偶
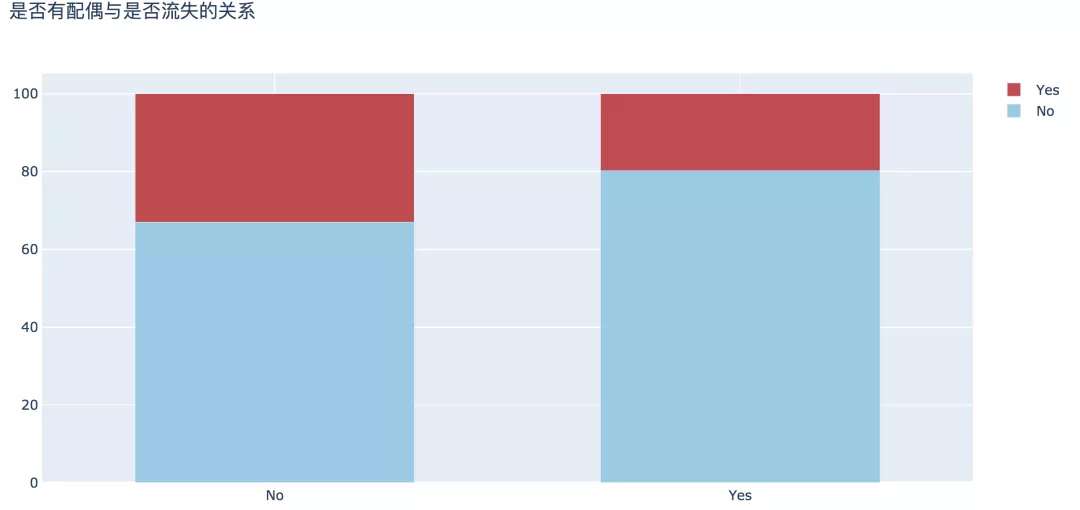
从婚姻情况来看,数据显示,未婚人群中流失的比例比已婚人数高出13%。
plot_bar(input_col='Partner', target_col='Churn', title_name='是否有配偶与是否流失的关系')
5. 上网时长

经过分析,这方面可以得出两个结论:
用户的在网时长越长,表示用户的忠诚度越高,其流失的概率越低;
新用户在1年内的流失率显著高于整体流失率,为47.68%。
plot_bar(input_col='tenure_group', target_col='Churn', title_name='在网时长与是否流失的关系')
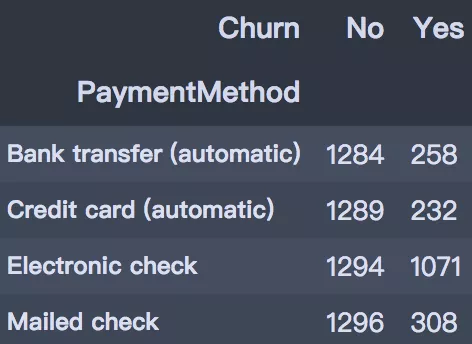
6. 付款方式
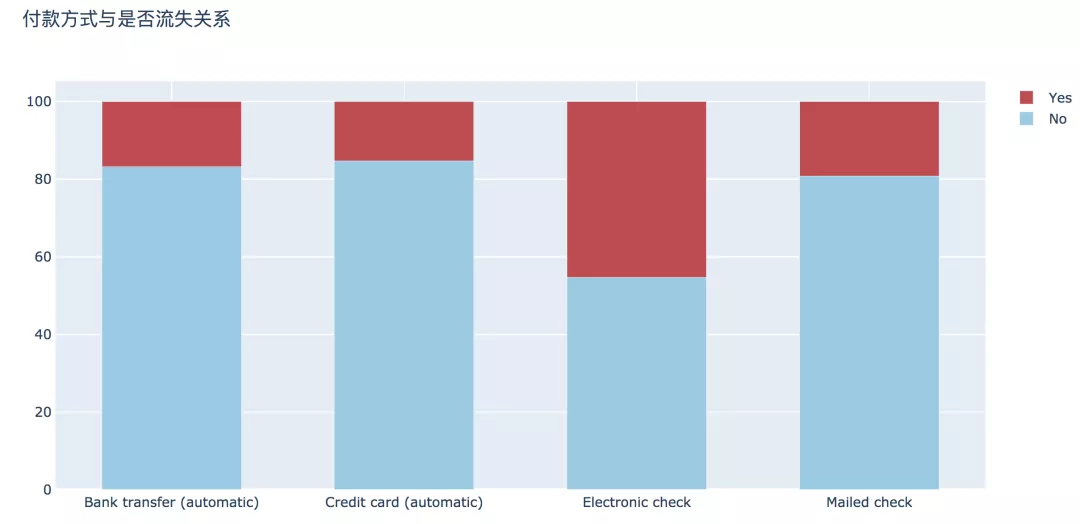
支付方式上,支付上,选择电子支票支付方式的用户流失最高,达到45.29%,其他三种支付方式的流失率相差不大。
pd.crosstab(df['PaymentMethod'], df['Churn'])
plot_bar(input_col='PaymentMethod', target_col='Churn', title_name='付款方式与是否流失关系')
7. 月费用
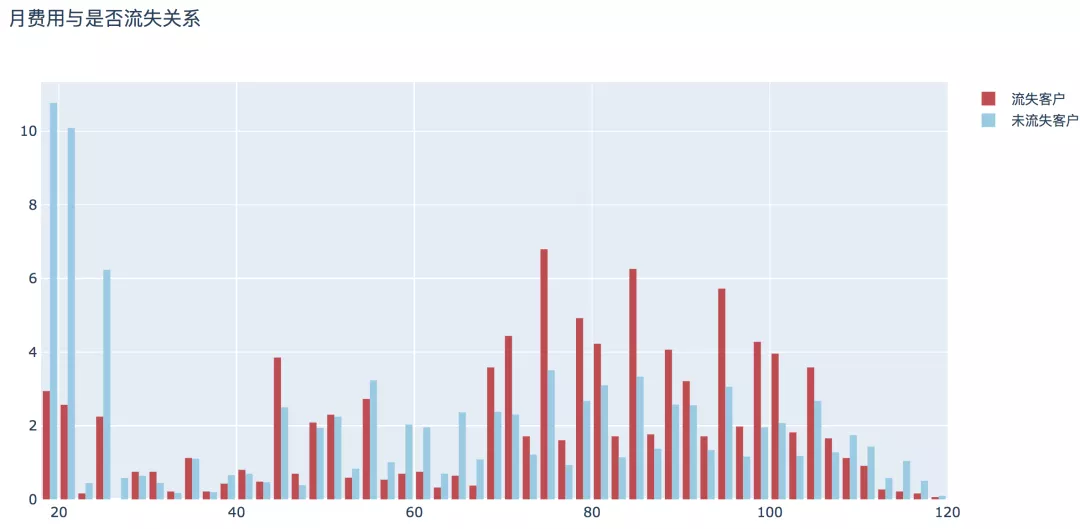
整体来看,随着月费用的增加,流失用户的比例呈现高高低低的变化,月消费80-100元的用户相对较高。
plot_histogram(input_col='MonthlyCharges', title_name='月费用与是否流失关系')
8. 数值型属性相关性
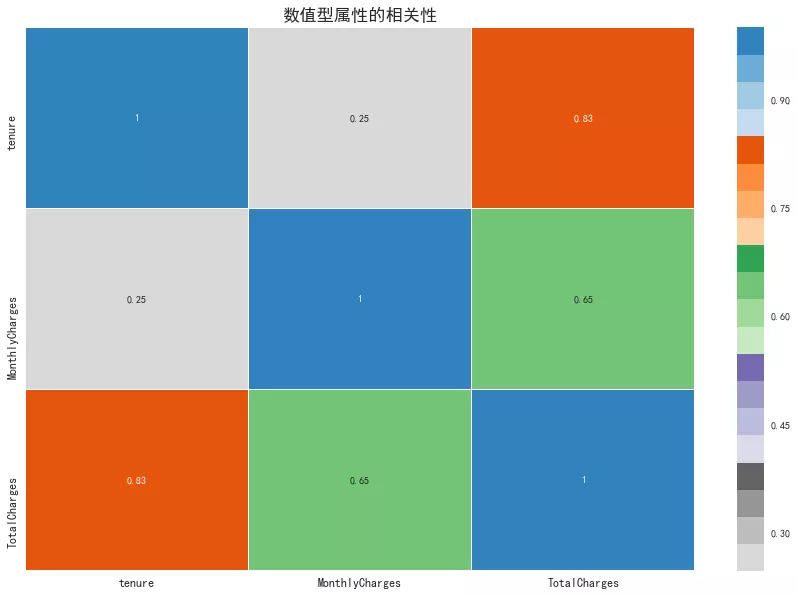
从相关性矩阵图可以看出,用户的往来期间和总费用呈现高度相关,往来期间越长,则总费用越高。月消费和总消费呈现显著相关。
plt.figure(figsize=(15, 10)) sns.heatmap(df.corr(), linewidths=0.1, cmap='tab20c_r', annot=True) plt.title('数值型属性的相关性', fontdict={'fontsize': 'xx-large', 'fontweight':'heavy'}) plt.xticks(fontsize=12) plt.yticks(fontsize=12) plt.show()06、特征选择
使用统计检定方式进行特征筛选。
# 删除tenure df = df.drop('tenure', axis=1) from feature_selection import Feature_select # 划分X和y X = df.drop(['customerID', 'Churn'], axis=1) y = df['Churn'] fs = Feature_select(num_method='anova', cate_method='kf', pos_label='Yes') x_sel = fs.fit_transform(X, y)2020 09:30:02 INFO attr select success! After select attr: ['DeviceProtection', 'MultipleLines', 'OnlineSecurity', 'TechSupport', 'tenure_group', 'PaperlessBilling', 'InternetService', 'PaymentMethod', 'SeniorCitizen', 'MonthlyCharges', 'Dependents', 'Partner', 'Contract', 'StreamingTV', 'TotalCharges', 'StreamingMovies', 'OnlineBackup']
经过特征筛选,gender和PhoneService字段被去掉。
07、建模前处理
在python中,为满足建模需要,一般需要对数据做以下处理:
对于二分类变量,编码为0和1;
对于多分类变量,进行one_hot编码;
对于数值型变量,部分模型如KNN、神经网络、Logistic需要进行标准化处理。
# 筛选变量 select_features = x_sel.columns # 建模数据 df_model = pd.concat([df['customerID'], df[select_features], df['Churn']], axis=1) Id_col = ['customerID'] target_col = ['Churn'] # 分类型 cat_cols = df_model.nunique()[df_model.nunique() < 10].index.tolist() # 二分类属性 binary_cols = df_model.nunique()[df_model.nunique() == 2].index.tolist() # 多分类属性 multi_cols = [i for i in cat_cols if i not in binary_cols] # 数值型 num_cols = [i for i in df_model.columns if i not in cat_cols + Id_col] # 二分类-标签编码 le = LabelEncoder() for i in binary_cols: df_model[i] = le.fit_transform(df_model[i]) # 多分类-哑变量转换 df_model = pd.get_dummies(data=df_model, columns=multi_cols) df_model.head()
08、模型建立和评估
首先使用分层抽样的方式将数据划分训练集和测试集。
# 重新划分 X = df_model.drop(['customerID', 'Churn'], axis=1) y = df_model['Churn'] # 分层抽样 X_train, X_test, y_train, y_test = train_test_split(X, y, test_size=0.2, random_state=0, stratify=y) print(X_train.shape, X_test.shape, y_train.shape, y_test.shape) #修正索引 for i in [X_train, X_test, y_train, y_test]: i.index = range(i.shape[0])
(5625, 31) (1407, 31) (5625,) (1407,)
# 保存标准化训练和测试数据 st = StandardScaler() num_scaled_train = pd.DataFrame(st.fit_transform(X_train[num_cols]), columns=num_cols) num_scaled_test = pd.DataFrame(st.transform(X_test[num_cols]), columns=num_cols) X_train_sclaed = pd.concat([X_train.drop(num_cols, axis=1), num_scaled_train], axis=1) X_test_sclaed = pd.concat([X_test.drop(num_cols, axis=1), num_scaled_test], axis=1)
然后建立一系列基准模型并比较效果。
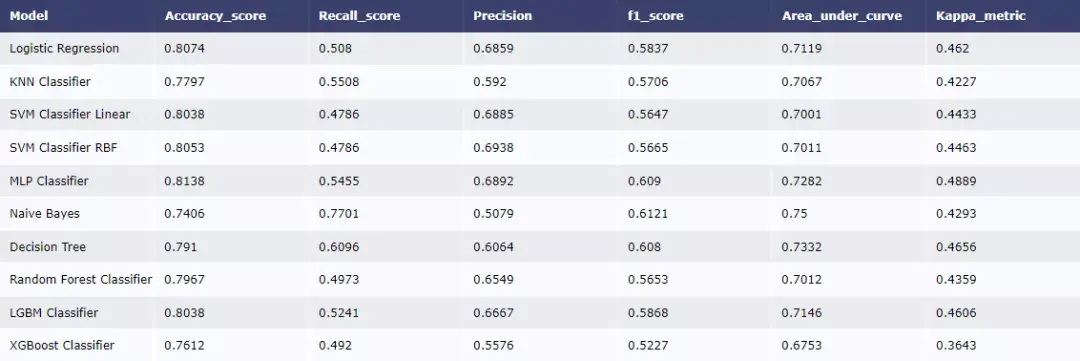
假如我们关注roc指标,从模型表现效果来看,Naive Bayes效果最好。我们也可以对模型进行进一步优化,比如对决策树参数进行调优。
parameters = {'splitter': ('best','random'), 'criterion': ("gini","entropy"), "max_depth": [*range(3, 20)], } clf = DecisionTreeClassifier(random_state=25) GS = GridSearchCV(clf, parameters, scoring='f1', cv=10) GS.fit(X_train, y_train) print(GS.best_params_) print(GS.best_score_){'criterion': 'entropy', 'max_depth': 5, 'splitter': 'best'} 0.585900839405024clf = GS.best_estimator_ test_pred = clf.predict(X_test) print('测试集:\n', classification_report(y_test, test_pred))测试集: precision recall f1-score support 0 0.86 0.86 0.86 1033 1 0.61 0.61 0.61 374 accuracy 0.79 1407 macro avg 0.73 0.73 0.73 1407 weighted avg 0.79 0.79 0.79 1407
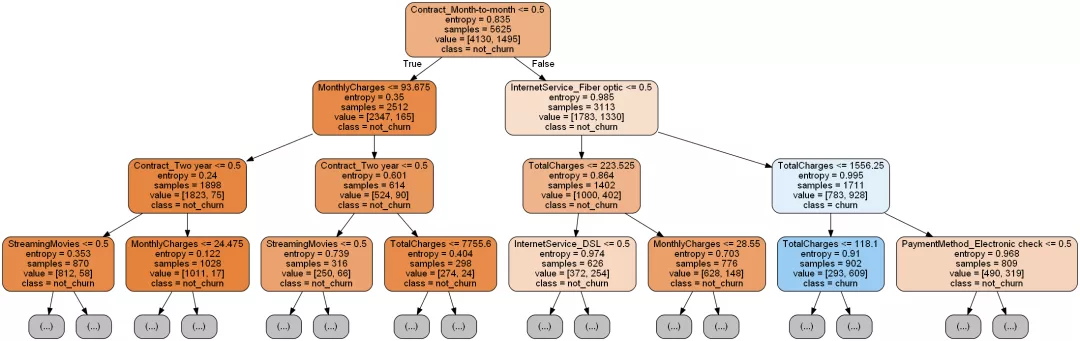
将这棵树绘制出来。
import graphviz dot_data = tree.export_graphviz(decision_tree=clf, max_depth=3, out_file=None, feature_names=X_train.columns, class_names=['not_churn', 'churn'], filled=True, rounded=True ) graph = graphviz.Source(dot_data)
输出决策树属性重要性排序:
imp = pd.DataFrame(zip(X_train.columns, clf.feature_importances_)) imp.columns = ['feature', 'importances'] imp = imp.sort_values('importances', ascending=False) imp = imp[imp['importances'] != 0] table = ff.create_table(np.round(imp, 4)) py.offline.iplot(table)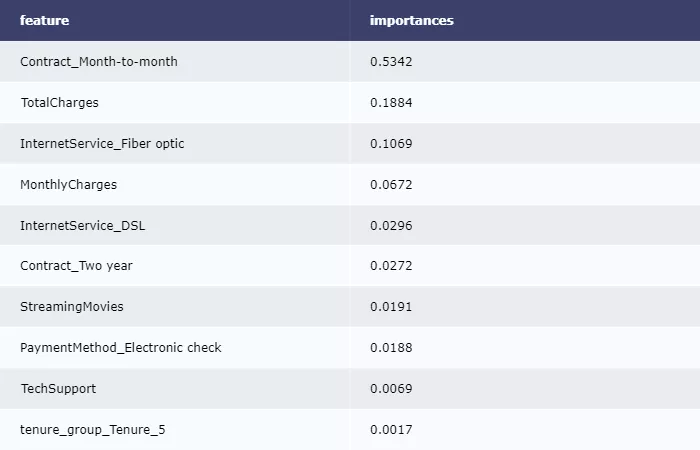
后续优化方向:
数据:分类技术应用在目标类别分布越均匀的数据集时,其所建立之分类器通常会有比较好的分类效能。针对数据在目标字段上分布不平衡,可采用过采样和欠采样来处理类别不平衡问题;
属性:进一步属性筛选方法和属性组合;
算法:参数调优;调整预测门槛值来增加预测效能。
感谢各位的阅读,以上就是“怎么用Python写一个电信客户流失预测模型”的内容了,经过本文的学习后,相信大家对怎么用Python写一个电信客户流失预测模型这一问题有了更深刻的体会,具体使用情况还需要大家实践验证。这里是亿速云,小编将为大家推送更多相关知识点的文章,欢迎关注!
免责声明:本站发布的内容(图片、视频和文字)以原创、转载和分享为主,文章观点不代表本网站立场,如果涉及侵权请联系站长邮箱:is@yisu.com进行举报,并提供相关证据,一经查实,将立刻删除涉嫌侵权内容。