您好,登录后才能下订单哦!
密码登录
登录注册
点击 登录注册 即表示同意《亿速云用户服务条款》
这篇“plot绘图填充的方法是什么”文章的知识点大部分人都不太理解,所以小编给大家总结了以下内容,内容详细,步骤清晰,具有一定的借鉴价值,希望大家阅读完这篇文章能有所收获,下面我们一起来看看这篇“plot绘图填充的方法是什么”文章吧。
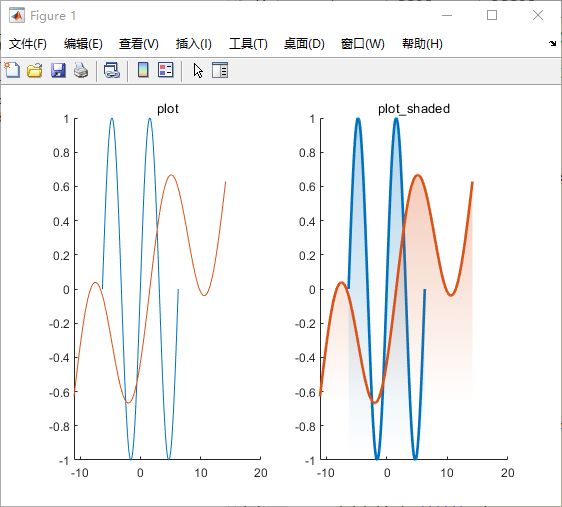
%% 简单曲线
x = -2*pi:pi/100:2*pi;
fx = sin(x);
figure('Color','w');
%设置figure颜色为白(去掉四周灰色部分)
subplot(1,2,1);
hold on
plot(x,fx);
plot(2*x+pi/2,0.5*fx+0.1*x);
hold off
title('plot');
subplot(1,2,2);
hold on
plot_shaded(x,fx);
plot_shaded(2*x+pi/2,0.5*fx+0.1*x);
hold off
title('plot\_shaded');
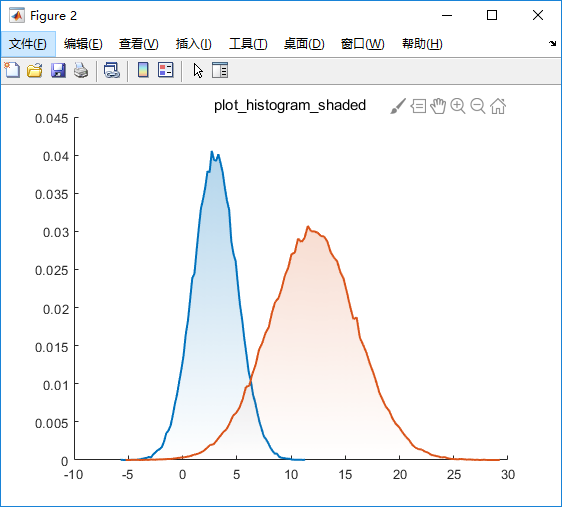
%% 直方图
X1 = 3 + 2.0*randn([100000,1]);
X2 = 12 + 4.0*randn([100000,1]);
figure('Color','w');
hold on
plot_histogram_shaded(X1,'Alpha',0.3);
%参数Alpha为透明度
plot_histogram_shaded(X2);
hold off
title('plot\_histogram\_shaded');
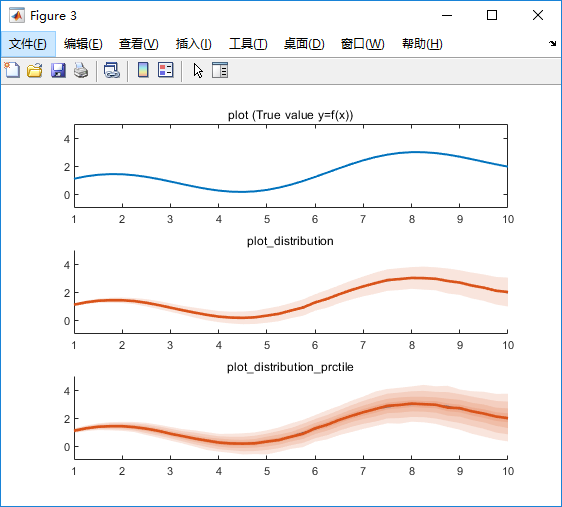
%% 分布图
X = 1:0.25:10;
Y = sin(X)+0.25*X;
Y_error = randn(1000,numel(Y));
Y_noisy = Y+Y_error.*repmat(0.1*X,[size(Y_error,1) 1]);
figure('Color','w');
subplot(3,1,1);
plot(X,Y,'LineWidth',1.5);
title('plot (True value y=f(x))');
ylim([-1 5]);
subplot(3,1,2);
hold on
plot(X,Y,'LineWidth',1.5);
plot_distribution(X,Y_noisy);
hold off
title('plot\_distribution');
ylim([-1 5]);
subplot(3,1,3);
hold on
plot(X,Y,'LineWidth',1.5);
%参数LineWidth为线宽
plot_distribution_prctile(X,Y_noisy,'Prctile',[25 50 75 90]);
%参数Prctile为要绘制的百分位值
hold off
title('plot\_distribution\_prctile');
ylim([-1 5]);
以上就是关于“plot绘图填充的方法是什么”这篇文章的内容,相信大家都有了一定的了解,希望小编分享的内容对大家有帮助,若想了解更多相关的知识内容,请关注亿速云行业资讯频道。
免责声明:本站发布的内容(图片、视频和文字)以原创、转载和分享为主,文章观点不代表本网站立场,如果涉及侵权请联系站长邮箱:is@yisu.com进行举报,并提供相关证据,一经查实,将立刻删除涉嫌侵权内容。