жӮЁеҘҪпјҢзҷ»еҪ•еҗҺжүҚиғҪдёӢи®ўеҚ•е“ҰпјҒ
еҜҶз Ғзҷ»еҪ•
зҷ»еҪ•жіЁеҶҢ
зӮ№еҮ» зҷ»еҪ•жіЁеҶҢ еҚіиЎЁзӨәеҗҢж„ҸгҖҠдәҝйҖҹдә‘з”ЁжҲ·жңҚеҠЎжқЎж¬ҫгҖӢ
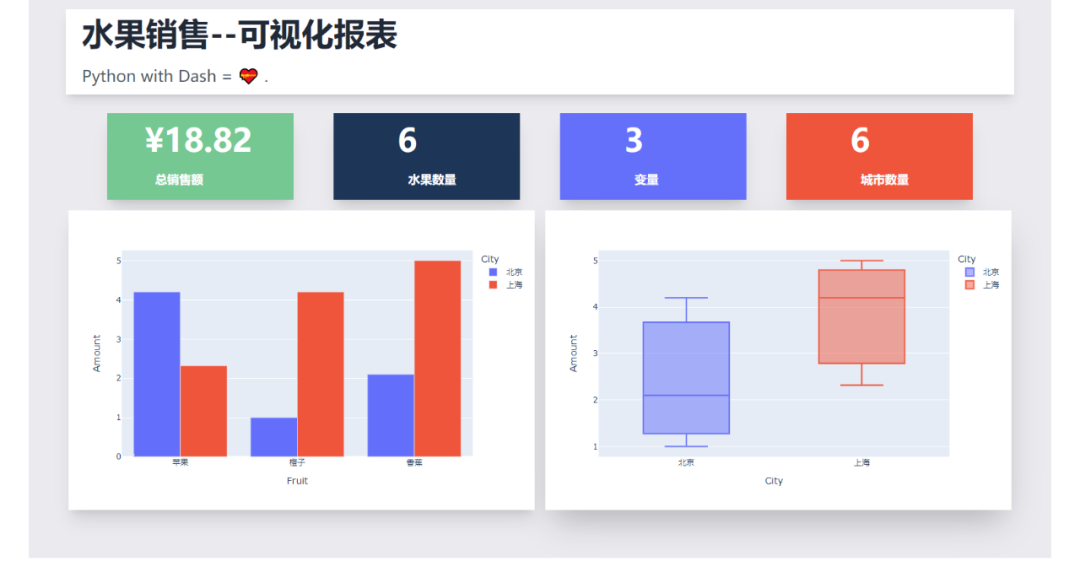
иҝҷзҜҮж–Үз« з»ҷеӨ§е®¶еҲҶдә«зҡ„жҳҜжңүе…іPythonеҰӮдҪ•еҲ¶дҪңеҸҜи§ҶеҢ–жҠҘиЎЁзҡ„еҶ…е®№гҖӮе°Ҹзј–и§үеҫ—жҢәе®һз”Ёзҡ„пјҢеӣ жӯӨеҲҶдә«з»ҷеӨ§е®¶еҒҡдёӘеҸӮиҖғпјҢдёҖиө·и·ҹйҡҸе°Ҹзј–иҝҮжқҘзңӢзңӢеҗ§гҖӮ
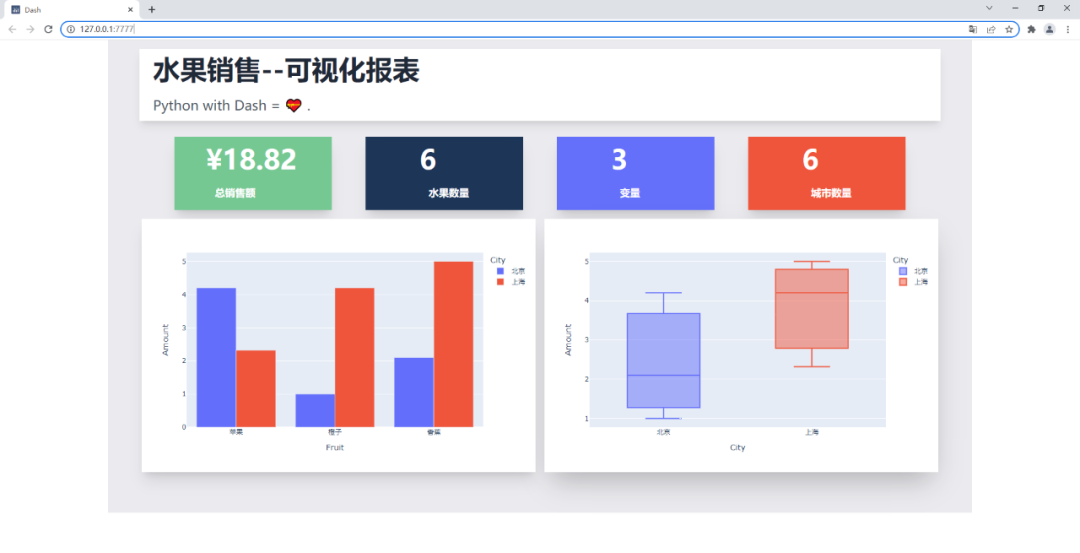
еҸҜи§ҶеҢ–жҠҘиЎЁж•ҲжһңеҰӮдёӢпјҢж°ҙжһңй”Җе”®жғ…еҶөдёҖи§Ҳ~
DashжҳҜеҹәдәҺPlotlyжҗӯе»әзҡ„DashbordжЎҶжһ¶пјҢж”ҜжҢҒPythonгҖҒRе’ҢJuliaгҖӮдҪҝз”ЁDashпјҢдҪ еҸҜд»ҘеҲӣе»әиҮӘе®ҡд№үе“Қеә”ејҸд»ӘиЎЁжқҝгҖӮ

зӣёе…іж–ҮжЎЈ
иҜҙжҳҺпјҡhttps://dash.plotly.com/introduction
жЎҲдҫӢпјҡhttps://dash.gallery/Portal/
TailwindcssеҲҷжҳҜдёҖдёӘе®һз”ЁзЁӢеәҸдјҳе…Ҳзҡ„CSSжЎҶжһ¶пјҢз”ЁдәҺеҝ«йҖҹжһ„е»әиҮӘе®ҡд№үз•ҢйқўгҖӮ
вҖңиҝҷз§ҚжЎҶжһ¶еҸӘйҖӮз”ЁдәҺйӮЈз§ҚеҸӘдјҡе®һзҺ°йЎөйқўеёғеұҖзҫҺеҢ–е…ғзҙ иҖҢдёҚе…іеҝғе®һзҺ°дёҡеҠЎйҖ»иҫ‘зҡ„еүҚз«ҜвҖқгҖӮ
зңӢзңӢеҲ«дәәеҜ№е®ғзҡ„иҜ„д»·пјҢеҜ№дәҺж— дәӨдә’зҡ„еӣҫиЎЁпјҢе®Ңе…Ёи¶іеӨҹдәҶгҖӮ
зӣёе…іж–ҮжЎЈ
иҜҙжҳҺпјҡhttps://www.tailwindcss.cn/docs
дёӢйқўе°ұз»ҷеӨ§е®¶и®Іи§ЈдёӢеҰӮдҪ•йҖҡиҝҮDash+Tailwindcssжҗӯе»әеҸҜи§ҶеҢ–жҠҘиЎЁпҪһ
йҰ–е…Ҳе®үиЈ…зӣёе…ізҡ„Pythonеә“пјҢ然еҗҺеҜје…ҘгҖӮ
import dash
import pandas as pd
import plotly.express as px
from dash import dcc, html
дҪҝз”ЁеҲ°дәҶPandasгҖҒPlotlyгҖҒdashиҝҷдёүдёӘPythonеә“гҖӮ
жҲ‘们йңҖиҰҒжҠҠTailwindcssзҡ„CDNдҪңдёәexternal_scriptпјҢ并е°Ҷе…¶дј йҖ’з»ҷжҲ‘们зҡ„еә”з”ЁзЁӢеәҸе®һдҫӢпјҢиҝҷж ·жҲ‘们жүҚеҸҜд»ҘжҲҗеҠҹдҪҝз”ЁTailwindcssгҖӮ
# еҜје…Ҙtailwindcssзҡ„CDN
external_script = ["https://tailwindcss.com/", {"src": "https://cdn.tailwindcss.com"}]
# еҲӣе»әDashе®һдҫӢ
app = dash.Dash(
__name__,
external_scripts=external_script,
)
app.scripts.config.serve_locally = TrueдҪҝз”ЁPandasеҲӣе»әж°ҙжһңй”Җе”®ж•°жҚ®пјҢйҡҸдҫҝиҷҡжһ„дәҶдёҖдёӘгҖӮ
# еҲӣе»әж•°жҚ®
df = pd.DataFrame(
{
"Fruit": ["иӢ№жһң", "ж©ҷеӯҗ", "йҰҷи•ү", "иӢ№жһң", "ж©ҷеӯҗ", "йҰҷи•ү"],
"Amount": [4.2, 1.0, 2.1, 2.32, 4.20, 5.0],
"City": ["еҢ—дә¬", "еҢ—дә¬", "еҢ—дә¬", "дёҠжө·", "дёҠжө·", "дёҠжө·"],
}
)
print(df)з»“жһңеҰӮдёӢпјҢ3еҲ—6иЎҢпјҢеҢ…еҗ«ж°ҙжһңгҖҒй”Җе”®йўқгҖҒеҹҺеёӮеҲ—гҖӮ

еӨ„зҗҶдёҖдёӢзӣёе…ізҡ„ж•°жҚ®пјҢж°ҙжһңеҚ•ж•°гҖҒй”Җе”®жҖ»йўқгҖҒеҹҺеёӮеҚ•ж•°гҖҒеҸҳйҮҸж•°гҖӮ
# ж°ҙжһңеҚ•ж•° fruit_count = df.Fruit.count() # й”Җе”®жҖ»йўқ total_amt = df.Amount.sum() # еҹҺеёӮеҚ•ж•° city_count = df.City.count() # еҸҳйҮҸж•° variables = df.shape[1]
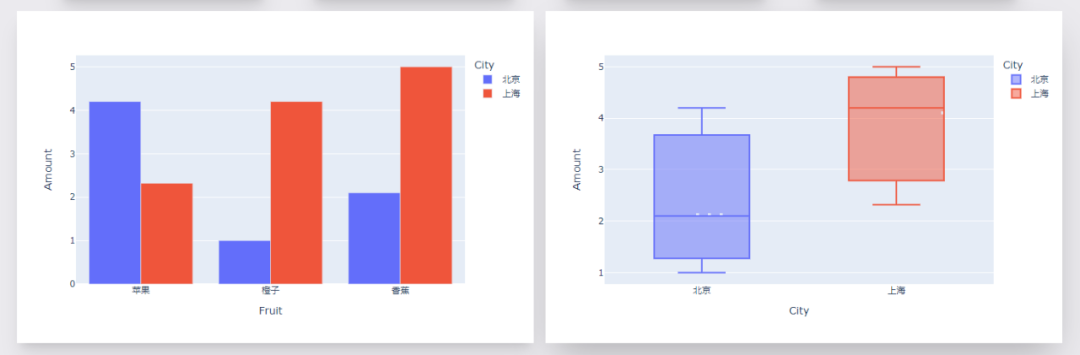
еҲӣе»әеӣҫиЎЁе®һдҫӢпјҢдёҖдёӘжҹұзҠ¶еӣҫгҖҒдёҖдёӘз®ұеһӢеӣҫгҖӮ
# жҹұзҠ¶еӣҫ1, дёҚеҗҢж°ҙжһңдёҚеҗҢеҹҺеёӮзҡ„й”Җе”®йўқ fig = px.bar(df, x="Fruit", y="Amount", color="City", barmode="group") # з®ұеһӢеӣҫ1, дёҚеҗҢеҹҺеёӮзҡ„й”Җе”®йўқеҲҶеёғжғ…еҶө fig1 = px.box(df, x="City", y="Amount", color="City")
ж•ҲжһңеҰӮдёӢгҖӮ
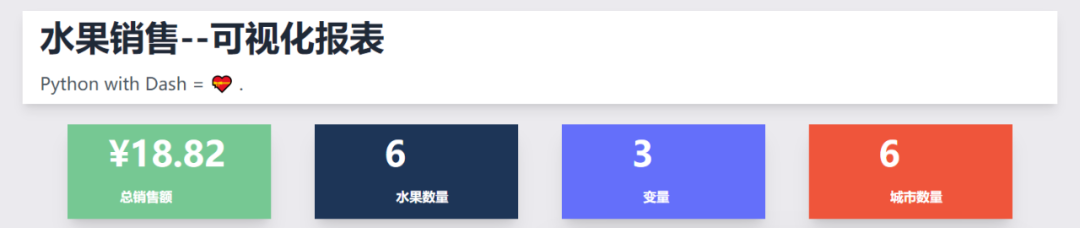
еү©дёӢе°ұжҳҜж–Үеӯ—жЁЎеқ—е•ҰпјҢж–Үеӯ—+CSSж ·ејҸгҖӮ
е…¶дёӯжҺ’зүҲеёғеұҖзҫҺеҢ–пјҢйҖҡиҝҮTailwindcssжқҘе®һзҺ°гҖӮ
app.layout = html.Div(
html.Div(
children=[
html.Div(
children=[
html.H1(children="ж°ҙжһңй”Җе”®--еҸҜи§ҶеҢ–жҠҘиЎЁ", className=" py-3 text-5xl font-bold text-gray-800"),
html.Div(
children="""Python with Dash = ???? .""",
className="text-left prose prose-lg text-2xl py-3 text-gray-600",
),
],
className="w-full mx-14 px-16 shadow-lg bg-white -mt-14 px-6 container my-3 ",
),
html.Div(
html.Div(
children=[
html.Div(
children=[
f"ВҘ{total_amt}",
html.Br(),
html.Span("жҖ»й”Җе”®йўқ", className="text-lg font-bold ml-4"),
],
className=" shadow-xl py-4 px-14 text-5xl bg-[#76c893] text-white font-bold text-gray-800",
),
html.Div(
children=[
fruit_count,
html.Br(),
html.Span("ж°ҙжһңж•°йҮҸ", className="text-lg font-bold ml-4"),
],
className=" shadow-xl py-4 px-24 text-5xl bg-[#1d3557] text-white font-bold text-gray-800",
),
html.Div(
children=[
variables,
html.Br(),
html.Span("еҸҳйҮҸ", className="inline-flex items-center text-lg font-bold ml-4"),
],
className=" shadow-xl py-4 px-24 text-5xl bg-[#646ffa] text-white font-bold text-gray-800",
),
html.Div(
children=[
city_count,
html.Br(),
html.Span("еҹҺеёӮж•°йҮҸ", className="text-lg font-bold ml-4"),
],
className="w-full shadow-xl py-4 px-24 text-5xl bg-[#ef553b] text-white font-bold text-gray-800",
),
],
className="my-4 w-full grid grid-flow-rows grid-cols-1 lg:grid-cols-4 gap-y-4 lg:gap-[60px]",
),
className="flex max-w-full justify-between items-center ",
),
html.Div(
children=[
html.Div(
children=[
dcc.Graph(id="example-graph", figure=fig),
],
className="shadow-xl w-full border-3 rounded-sm",
),
html.Div(
children=[
dcc.Graph(id="example-graph2", figure=fig1),
],
className="w-full shadow-2xl rounded-sm",
),
],
className="grid grid-cols-1 lg:grid-cols-2 gap-4",
),
],
className="bg-[#ebeaee] flex py-14 flex-col items-center justify-center ",
),
className="bg-[#ebeaee] container mx-auto px-14 py-4",
)ж•ҲжһңеҰӮдёӢгҖӮ
жңҖеҗҺеҗҜеҠЁзЁӢеәҸд»Јз ҒгҖӮ
if __name__ == '__main__': # debugжЁЎејҸ, з«ҜеҸЈ7777 app.run_server(debug=True, threaded=True, port=7777) # жӯЈеёёжЁЎејҸ, зҪ‘йЎөеҸідёӢи§’зҡ„и°ғиҜ•жҢүй’®е°ҶдёҚдјҡеҮәзҺ° # app.run_server(port=7777)
иҝҷж ·е°ұиғҪеңЁжң¬ең°зңӢеҲ°еҸҜи§ҶеҢ–еӨ§еұҸйЎөйқўпјҢжөҸи§ҲеҷЁжү“ејҖеҰӮдёӢең°еқҖгҖӮ
http://127.0.0.1:7777
ж„ҹи°ўеҗ„дҪҚзҡ„йҳ…иҜ»пјҒе…ідәҺвҖңPythonеҰӮдҪ•еҲ¶дҪңеҸҜи§ҶеҢ–жҠҘиЎЁвҖқиҝҷзҜҮж–Үз« е°ұеҲҶдә«еҲ°иҝҷйҮҢдәҶпјҢеёҢжңӣд»ҘдёҠеҶ…е®№еҸҜд»ҘеҜ№еӨ§е®¶жңүдёҖе®ҡзҡ„её®еҠ©пјҢи®©еӨ§е®¶еҸҜд»ҘеӯҰеҲ°жӣҙеӨҡзҹҘиҜҶпјҢеҰӮжһңи§үеҫ—ж–Үз« дёҚй”ҷпјҢеҸҜд»ҘжҠҠе®ғеҲҶдә«еҮәеҺ»и®©жӣҙеӨҡзҡ„дәәзңӢеҲ°еҗ§пјҒ
е…ҚиҙЈеЈ°жҳҺпјҡжң¬з«ҷеҸ‘еёғзҡ„еҶ…е®№пјҲеӣҫзүҮгҖҒи§Ҷйў‘е’Ңж–Үеӯ—пјүд»ҘеҺҹеҲӣгҖҒиҪ¬иҪҪе’ҢеҲҶдә«дёәдё»пјҢж–Үз« и§ӮзӮ№дёҚд»ЈиЎЁжң¬зҪ‘з«ҷз«ӢеңәпјҢеҰӮжһңж¶үеҸҠдҫөжқғиҜ·иҒ”зі»з«ҷй•ҝйӮ®з®ұпјҡis@yisu.comиҝӣиЎҢдёҫжҠҘпјҢ并жҸҗдҫӣзӣёе…іиҜҒжҚ®пјҢдёҖз»ҸжҹҘе®һпјҢе°Ҷз«ӢеҲ»еҲ йҷӨж¶үе«ҢдҫөжқғеҶ…е®№гҖӮ
жӮЁеҘҪпјҢзҷ»еҪ•еҗҺжүҚиғҪдёӢи®ўеҚ•е“ҰпјҒ