您好,登录后才能下订单哦!
这篇文章主要介绍“怎么使用ComplexHeatmap绘制单个热图”,在日常操作中,相信很多人在怎么使用ComplexHeatmap绘制单个热图问题上存在疑惑,小编查阅了各式资料,整理出简单好用的操作方法,希望对大家解答”怎么使用ComplexHeatmap绘制单个热图”的疑惑有所帮助!接下来,请跟着小编一起来学习吧!
ComplexHeatmap可以绘制很复杂的热图,能满足日常以及文章所需,本次先简单的介绍单个热图绘制的内容。
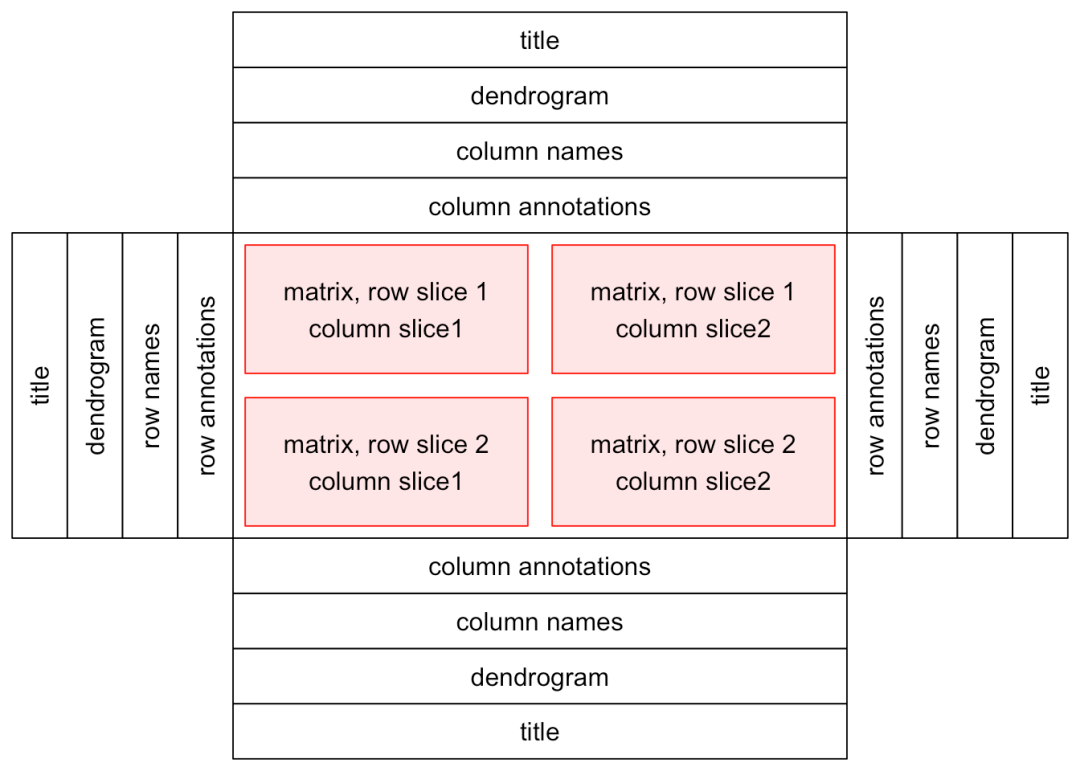
单个热图由热图主体和热图组件组成。其中主体可分为行和列;组件可以是标题、树状图、矩阵名称和热图注释,在主图的四周均可,且顺序可调整。
#if (!requireNamespace("BiocManager", quietly = TRUE))
#    install.packages("BiocManager")
#BiocManager::install("ComplexHeatmap")
library(ComplexHeatmap)为更贴近生信使用场景,直接使用内置的基因表达数据
expr = readRDS(paste0(system.file(package = "ComplexHeatmap"), "/extdata/gene_expression.rds"))
#查看数据
str(expr)
expr[1:4,c(1:4,25:27)]

拿到一个新数据后,除了检查[1:4,1:4]外,也许还需要看看最后几列,另外还需要观察列名称的规律。
去除最后几列,或者只选取列名字包含cell的(TCGA数据处理中也会经常遇到)
mat = as.matrix(expr[, grep("cell", colnames(expr))])Heatmap(mat)
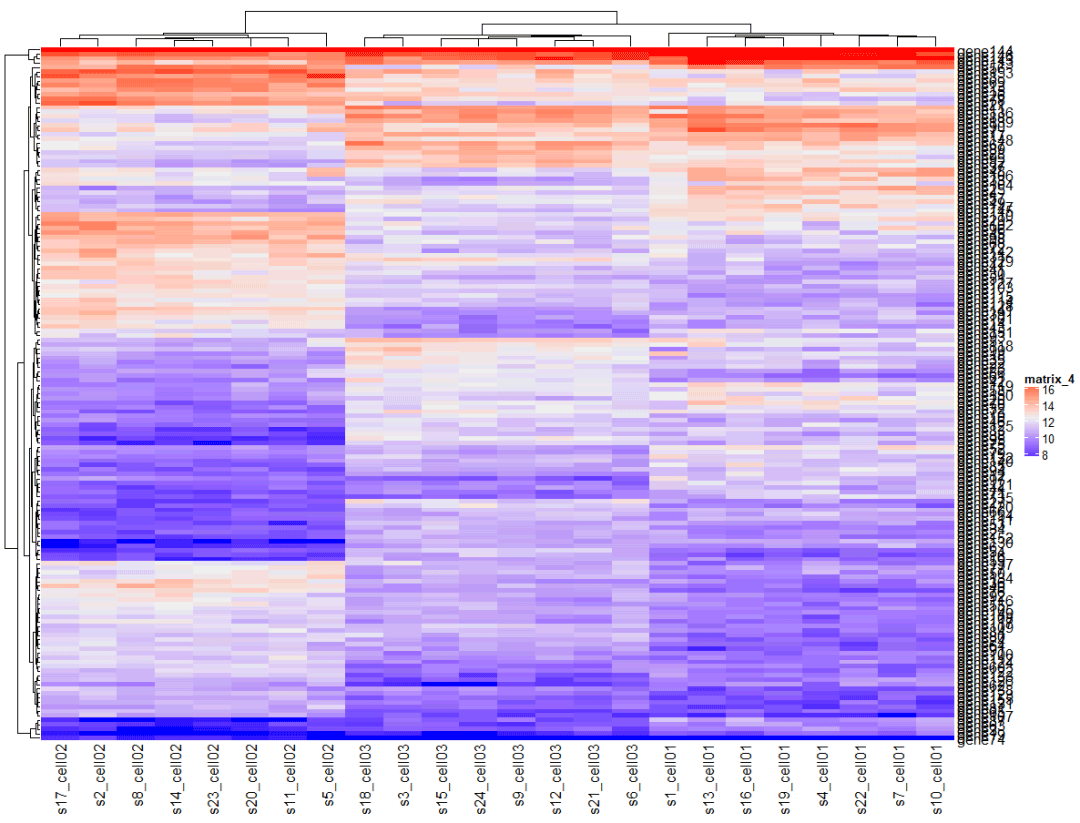
可以看到有很多需要“美化”的地方,别急,一点点来。
可以使用circle::colorRamp2()函数来生成Heatmap()中的颜色映射函数,输入参数为分割位置以及分割点上的颜色。下例中,大于12的值都映射为红色,小于12的值映射为绿色;
library(circlize)</code><code>#c中的范围要根据实际情况设置</code><code>col_fun = colorRamp2(c(8, 12, 16), c("green", "white", "red"))</code><code>Heatmap(mat, name = "mat", col = col_fun)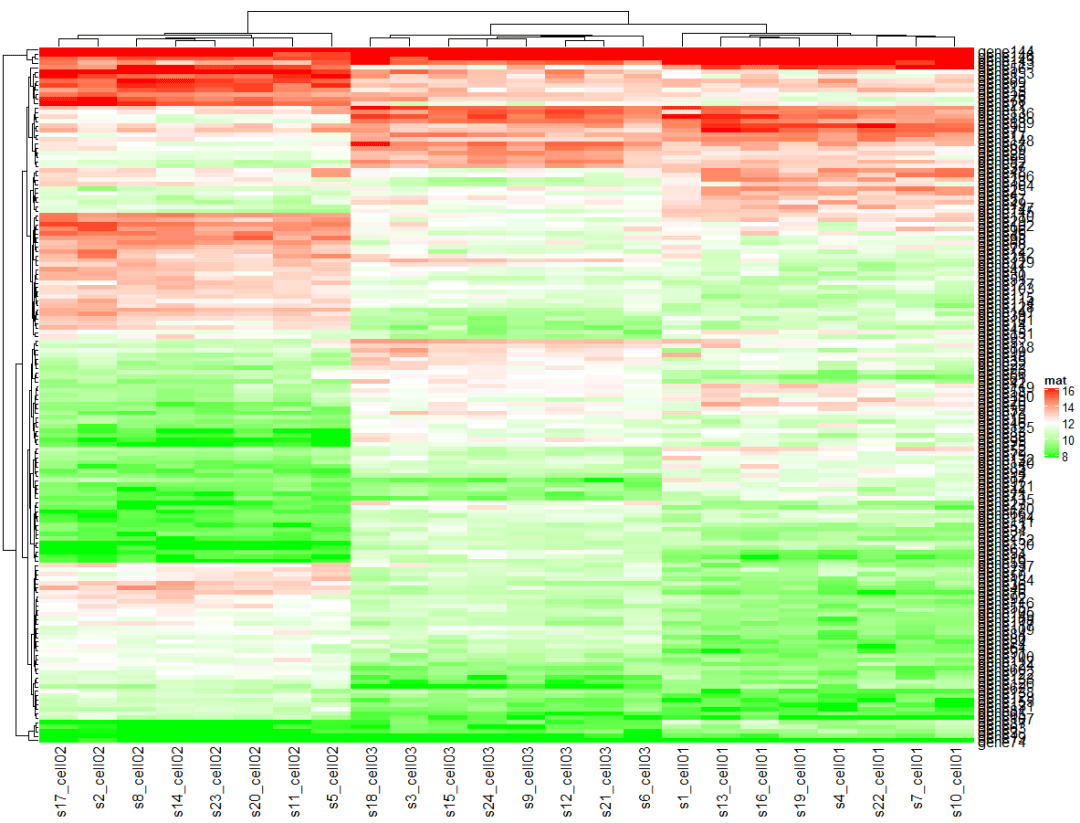
更改分类变量的颜色,需要把所有分类的数字均进行赋值。
discrete_mat = matrix(sample(1:4, 100, replace = TRUE), 10, 10)
colors = structure(1:4, names = c("1", "2", "3", "4")) # black, red, green, blue
Heatmap(discrete_mat, name = "mat", col = colors,
    column_title = "a discrete numeric matrix")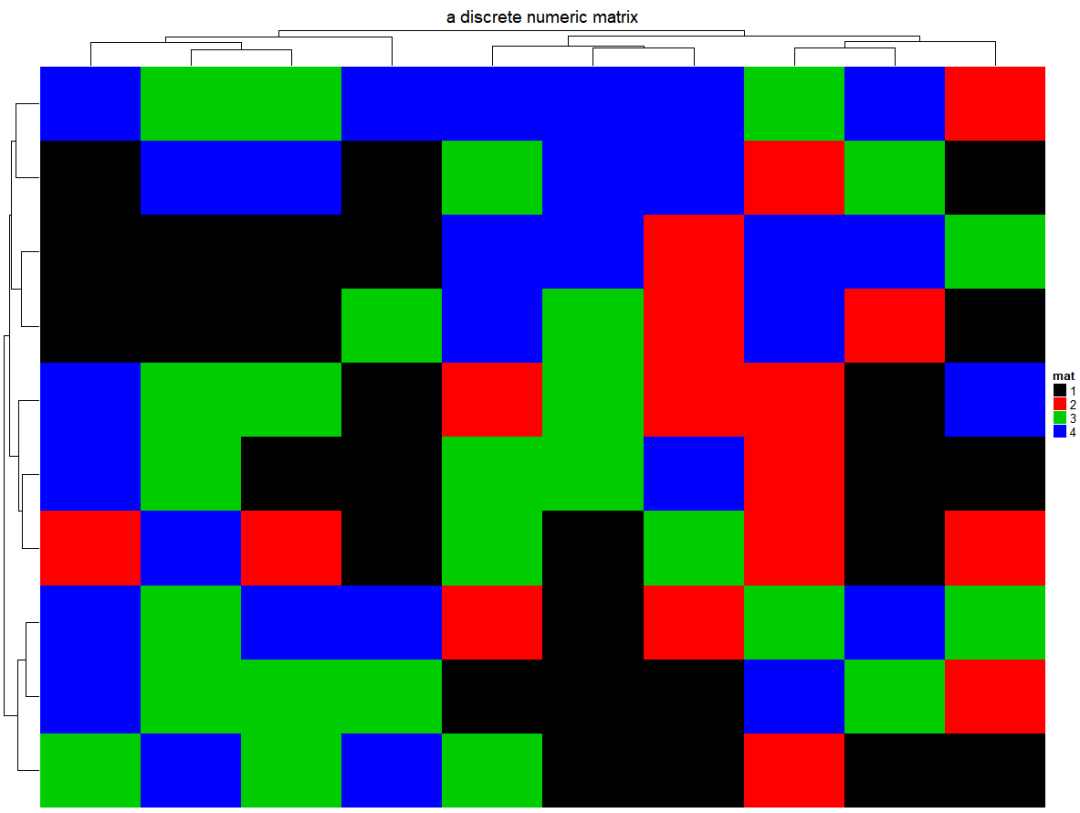
更多颜色修改请参考官方文档,文末的参考资料的链接。
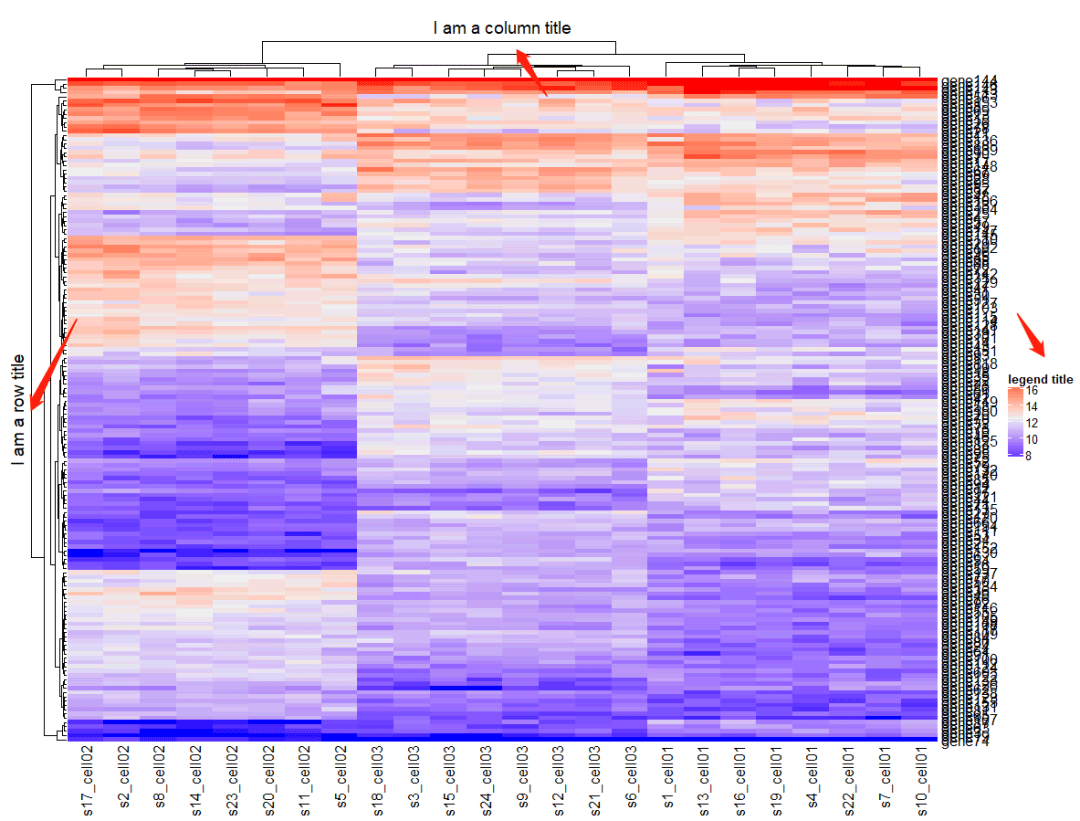
Heatmap(mat,
        name = "legend title", #图例title
        column_title = "I am a column title", #列title
        row_title = "I am a row title",
        column_title_side = "bottom") #行title
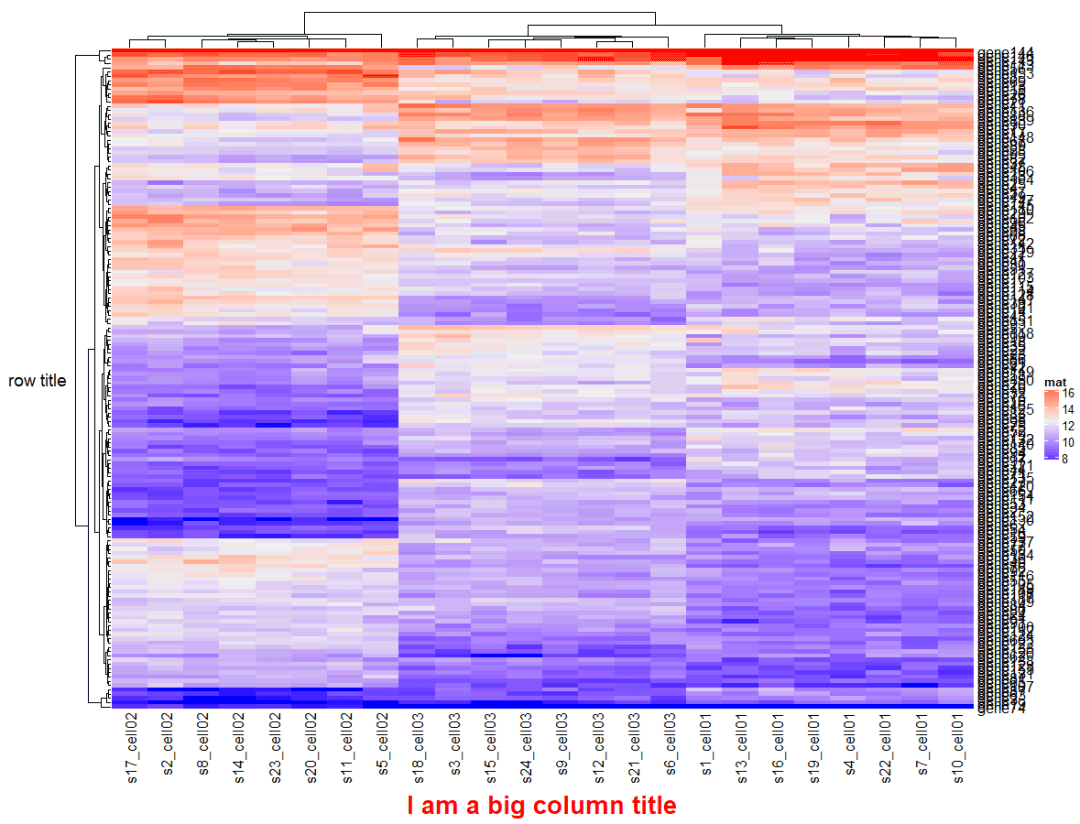
Heatmap(mat, name = "mat",
        row_title = "row title",
        row_title_rot = 0, #旋转方向
        column_title = "I am a big column title",
        column_title_side = "bottom", #标题位置
        column_title_gp = gpar(fontsize = 20, fontface = "bold",col = "red")) #颜色,字体,大小
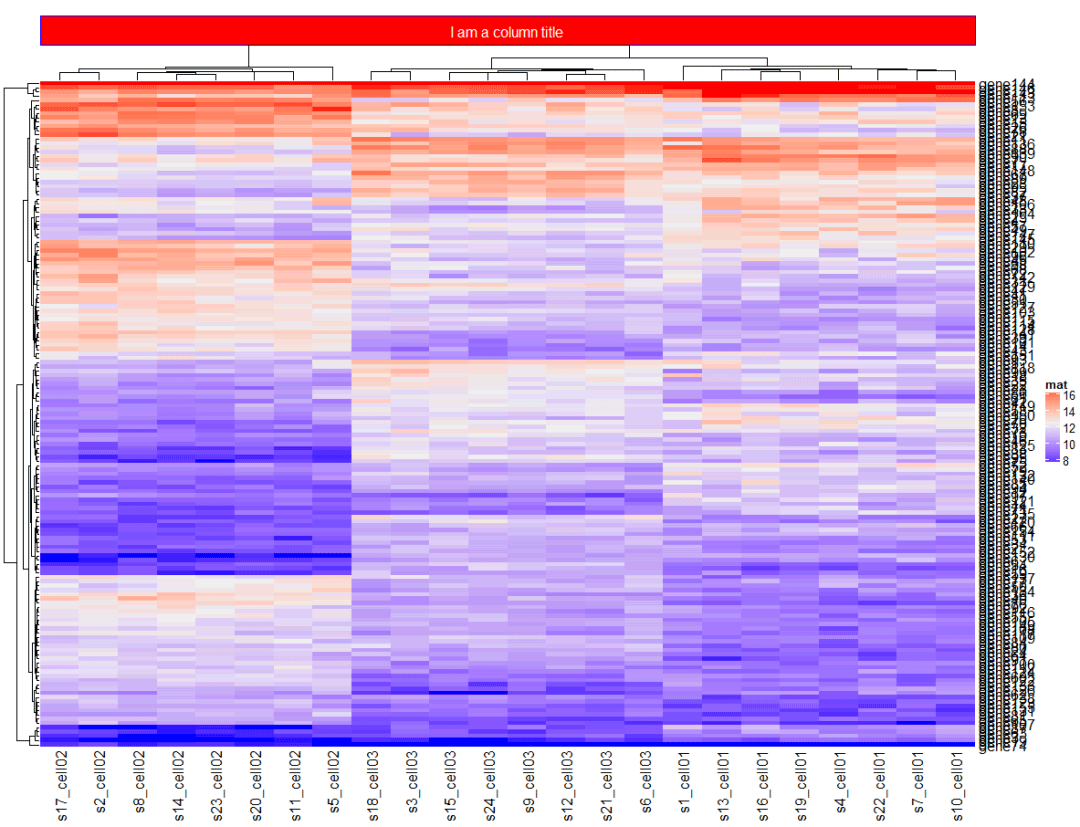
column_title_gp中的填充参数来设置标题的背景颜色
Heatmap(mat, name = "mat",
        column_title = "I am a column title",
        column_title_gp = gpar(fill = "red", col = "white", border = "blue"),
        )
聚类是热图可视化的关键组成部分,在ComplexHeatmap包中可以非常灵活的进行设置。
cluster_rows/columns :是否进行聚类
show_column/row_dend :是否显示聚类树
column/row_dend_side :聚类图绘制的位置
column_dend_height/row_dend_widht :聚类树的高度 和 宽度
Heatmap(mat, name = "mat",</code><code> cluster_columns = T, </code><code> cluster_rows = F, ## turn off row clustering</code><code> show_column_dend = T, ## hide column dendrogram</code><code> show_row_dend = F,</code><code> column_dend_side = "top", #dendrogram location</code><code> column_dend_height = unit(4, "cm"))
注意:聚类树的高度 和 宽度有区别。
可选计算距离的方式包括pearson, spearman以及kendall , 或者计算距离的自定义函数。
Heatmap(mat, name = "mat", clustering_distance_rows = "pearson",
    column_title = "pre-defined distance method (1 - pearson)")

自定义
Heatmap(mat, name = "mat", clustering_distance_rows = function(x, y) 1 - cor(x, y),
    column_title = "a function that calculates pairwise distance")
支持hclust()中的聚类方法。
Heatmap(mat, name = "mat", clustering_method_rows = "single")
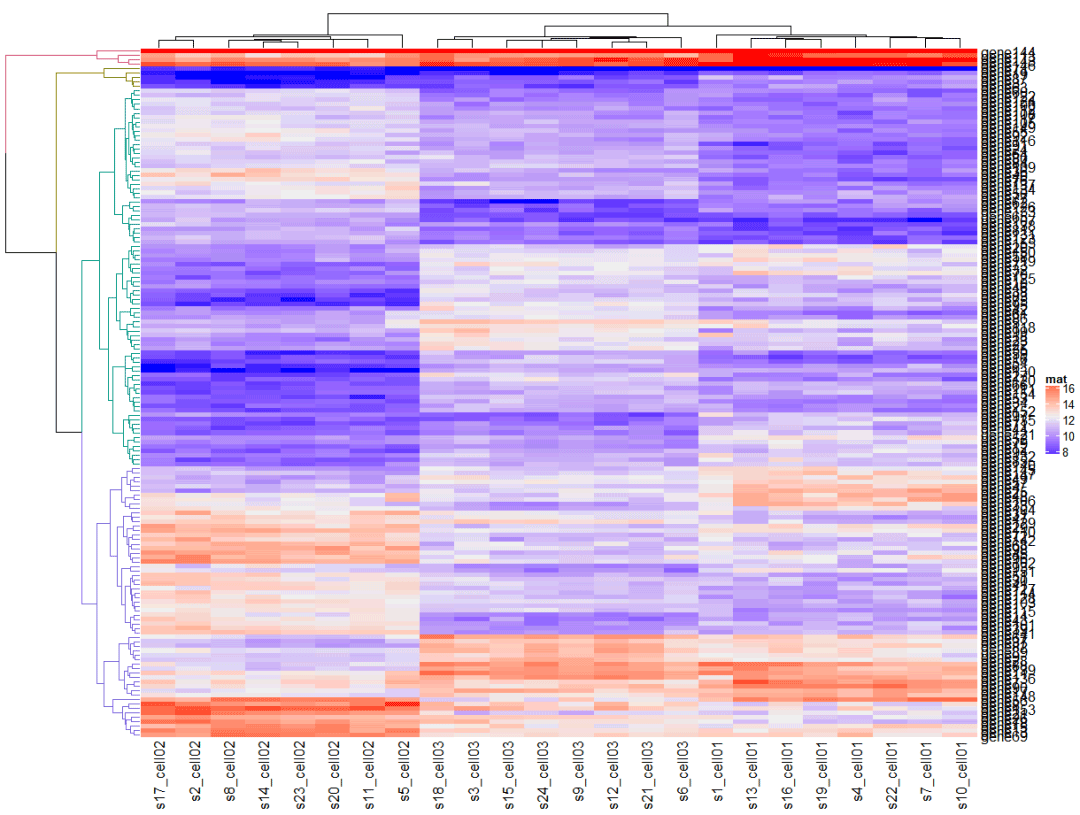
根据聚类结果将聚类树的枝设置不同的颜色
library(dendextend)</code><code>row_dend = as.dendrogram(hclust(dist(mat)))</code><code>row_dend = color_branches(row_dend, k = 4) # `color_branches()` returns a dendrogram object</code><code>Heatmap(mat, name = "mat", </code><code> cluster_rows = row_dend,</code><code> row_dend_width = unit(4, "cm"))
通过row_order/column_order函数自定义其排序,为方便展示选择前30个基因。
mat <- mat[1:30,]
Heatmap(mat, name = "mat",
          row_order = order(as.numeric(gsub("gene", "", rownames(mat)))), #将gene1替换为1,在排序
          column_order = sort(colnames(mat)),
          column_title = "reorder matrix")
注:此处将gene1,gene10 先替换掉gene(不去的话是按照ASCII码),然后按照数值排序。
到此,关于“怎么使用ComplexHeatmap绘制单个热图”的学习就结束了,希望能够解决大家的疑惑。理论与实践的搭配能更好的帮助大家学习,快去试试吧!若想继续学习更多相关知识,请继续关注亿速云网站,小编会继续努力为大家带来更多实用的文章!
免责声明:本站发布的内容(图片、视频和文字)以原创、转载和分享为主,文章观点不代表本网站立场,如果涉及侵权请联系站长邮箱:is@yisu.com进行举报,并提供相关证据,一经查实,将立刻删除涉嫌侵权内容。