您好,登录后才能下订单哦!
密码登录
登录注册
点击 登录注册 即表示同意《亿速云用户服务条款》
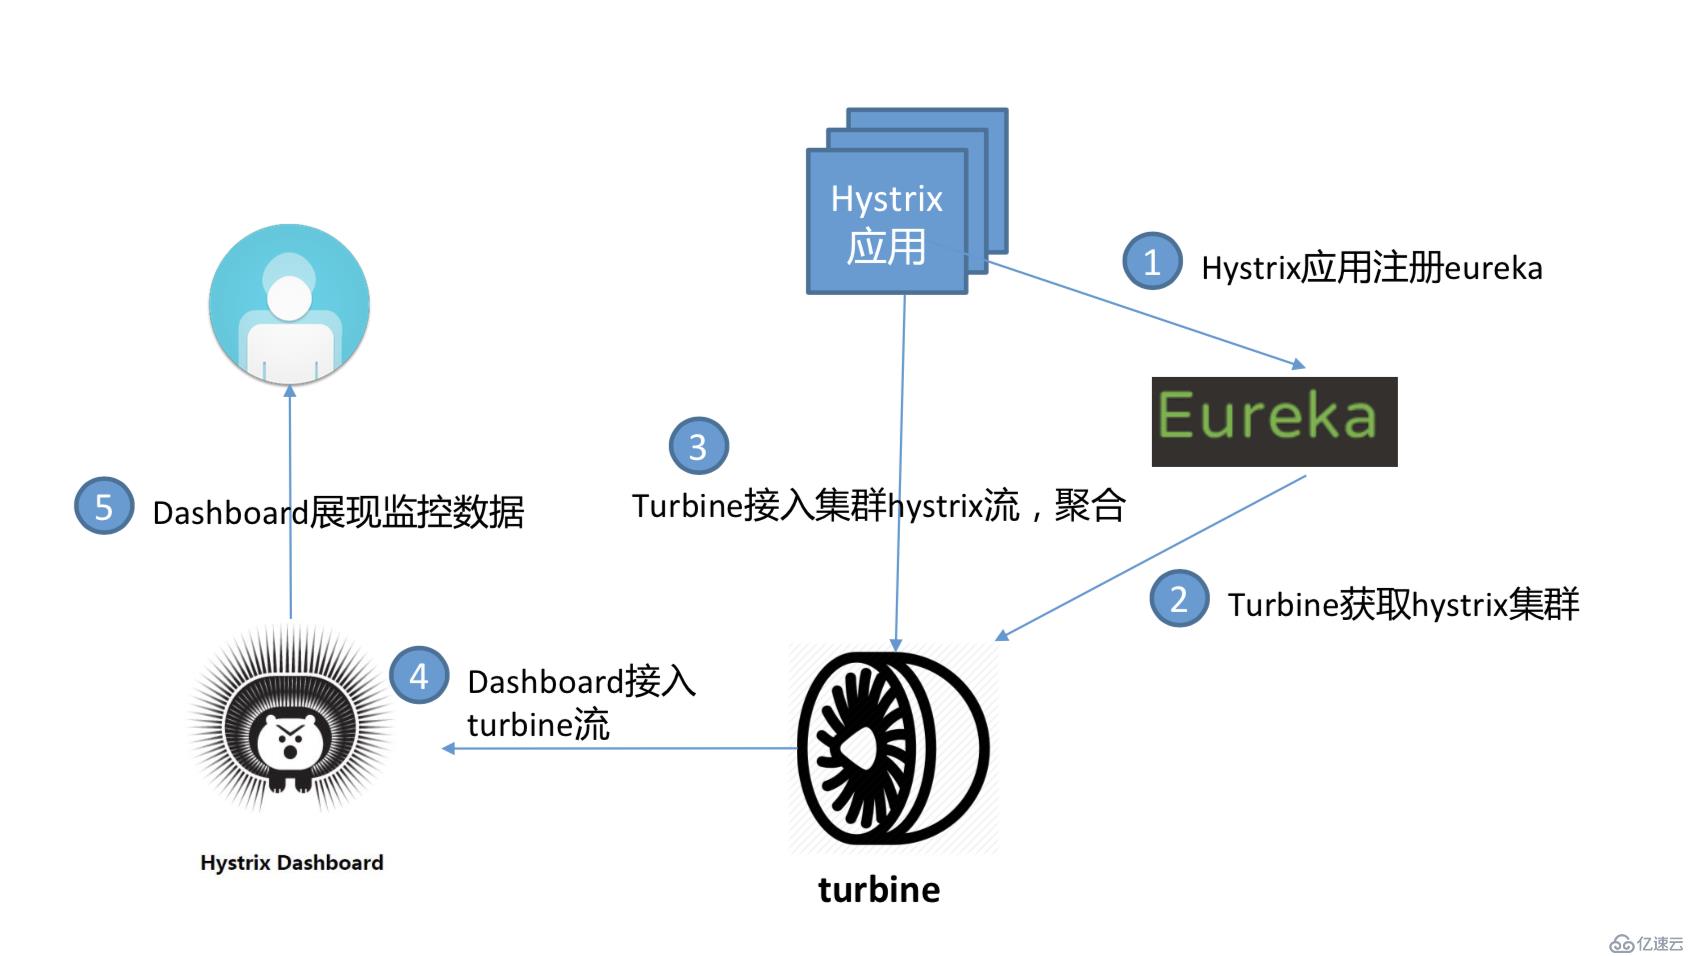
上一篇介绍了 Hystrix Dashboard 监控单体应用的例子,在生产环境中,监控的应用往往是一个集群,我们需要将每个实例的监控信息聚合起来分析,这就用到了 Turbine 工具。Turbine有一个重要的功能就是汇聚监控信息,并将汇聚到的监控信息提供给Hystrix Dashboard来集中展示和监控。
| 工程名 | 端口 | 作用 |
|---|---|---|
| eureka-server | 8761 | 注册中心 |
| service-hi | 8762 | 服务提供者 |
| service-consumer | 8763 | 服务消费者 |
| service-turbine | 8765 | Turbine服务 |
eureka-server 、service-hi、service-consumer 工程代码与上一节 微服务熔断限流Hystrix之Dashboard 相同,下面是 service-turbine 工程的核心代码。
<dependency>
    <groupId>org.springframework.cloud</groupId>
    <artifactId>spring-cloud-starter-netflix-eureka-client</artifactId>
</dependency>
<dependency>
    <groupId>org.springframework.cloud</groupId>
    <artifactId>spring-cloud-starter-netflix-turbine</artifactId>
</dependency>
<dependency>
    <groupId>org.springframework.boot</groupId>
    <artifactId>spring-boot-starter-actuator</artifactId>
</dependency>

<dependency>
    <groupId>org.springframework.cloud</groupId>
    <artifactId>spring-cloud-starter-netflix-hystrix</artifactId>
</dependency>
<dependency>
    <groupId>org.springframework.cloud</groupId>
    <artifactId>spring-cloud-starter-netflix-hystrix-dashboard</artifactId>
</dependency>server:
port: 8765
spring:
application:
name: service-turbine
eureka:
client:
service-url:
defaultZone: http://localhost:8761/eureka/
turbine:
app-config: service-consumer
cluster-name-expression: new String("default")
combine-host-port: true参数说明:
@SpringBootApplication
@EnableEurekaClient
@EnableHystrixDashboard
@EnableTurbine
public class ServiceTurbineApplication {

    public static void main(String[] args) {
        SpringApplication.run( ServiceTurbineApplication.class, args );
    }

}启动多个 service-consumer 工程,来模拟多实例,可以通过命令java -jar service-consumer.jar --server.port=XXXX 来实现。
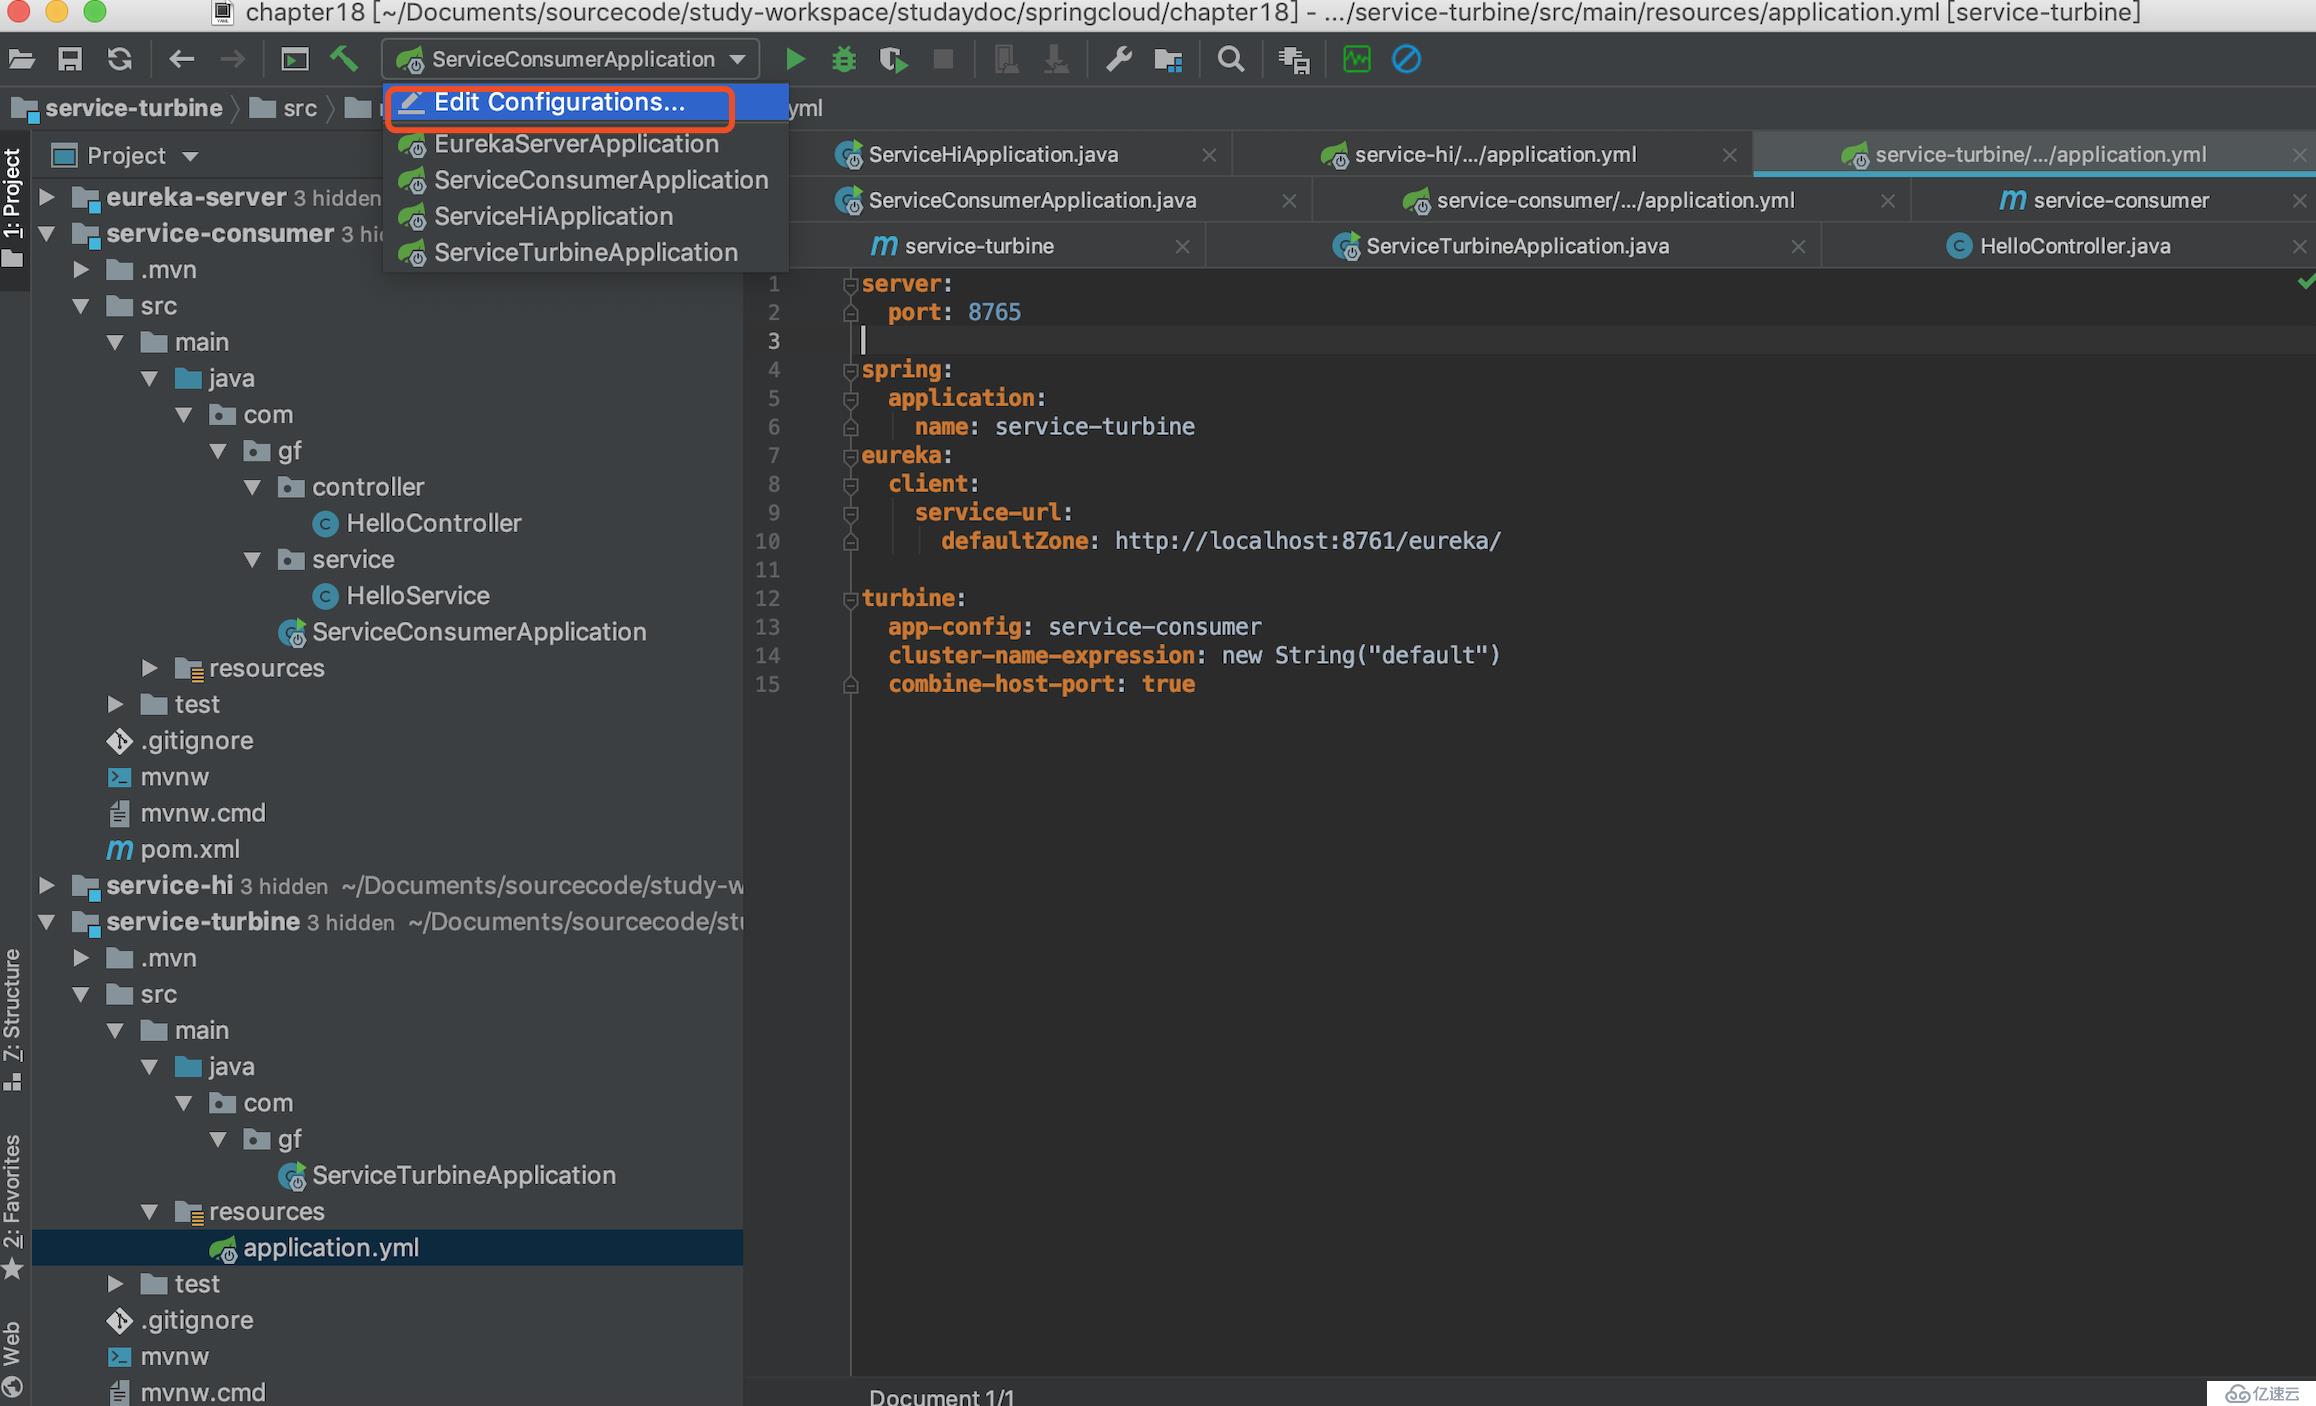
为了方便,在编辑器中实现启动工程。但 idea 不支持单个应用的多次启动, 需要开启并行启动:
选择 “Edit Configurations...”
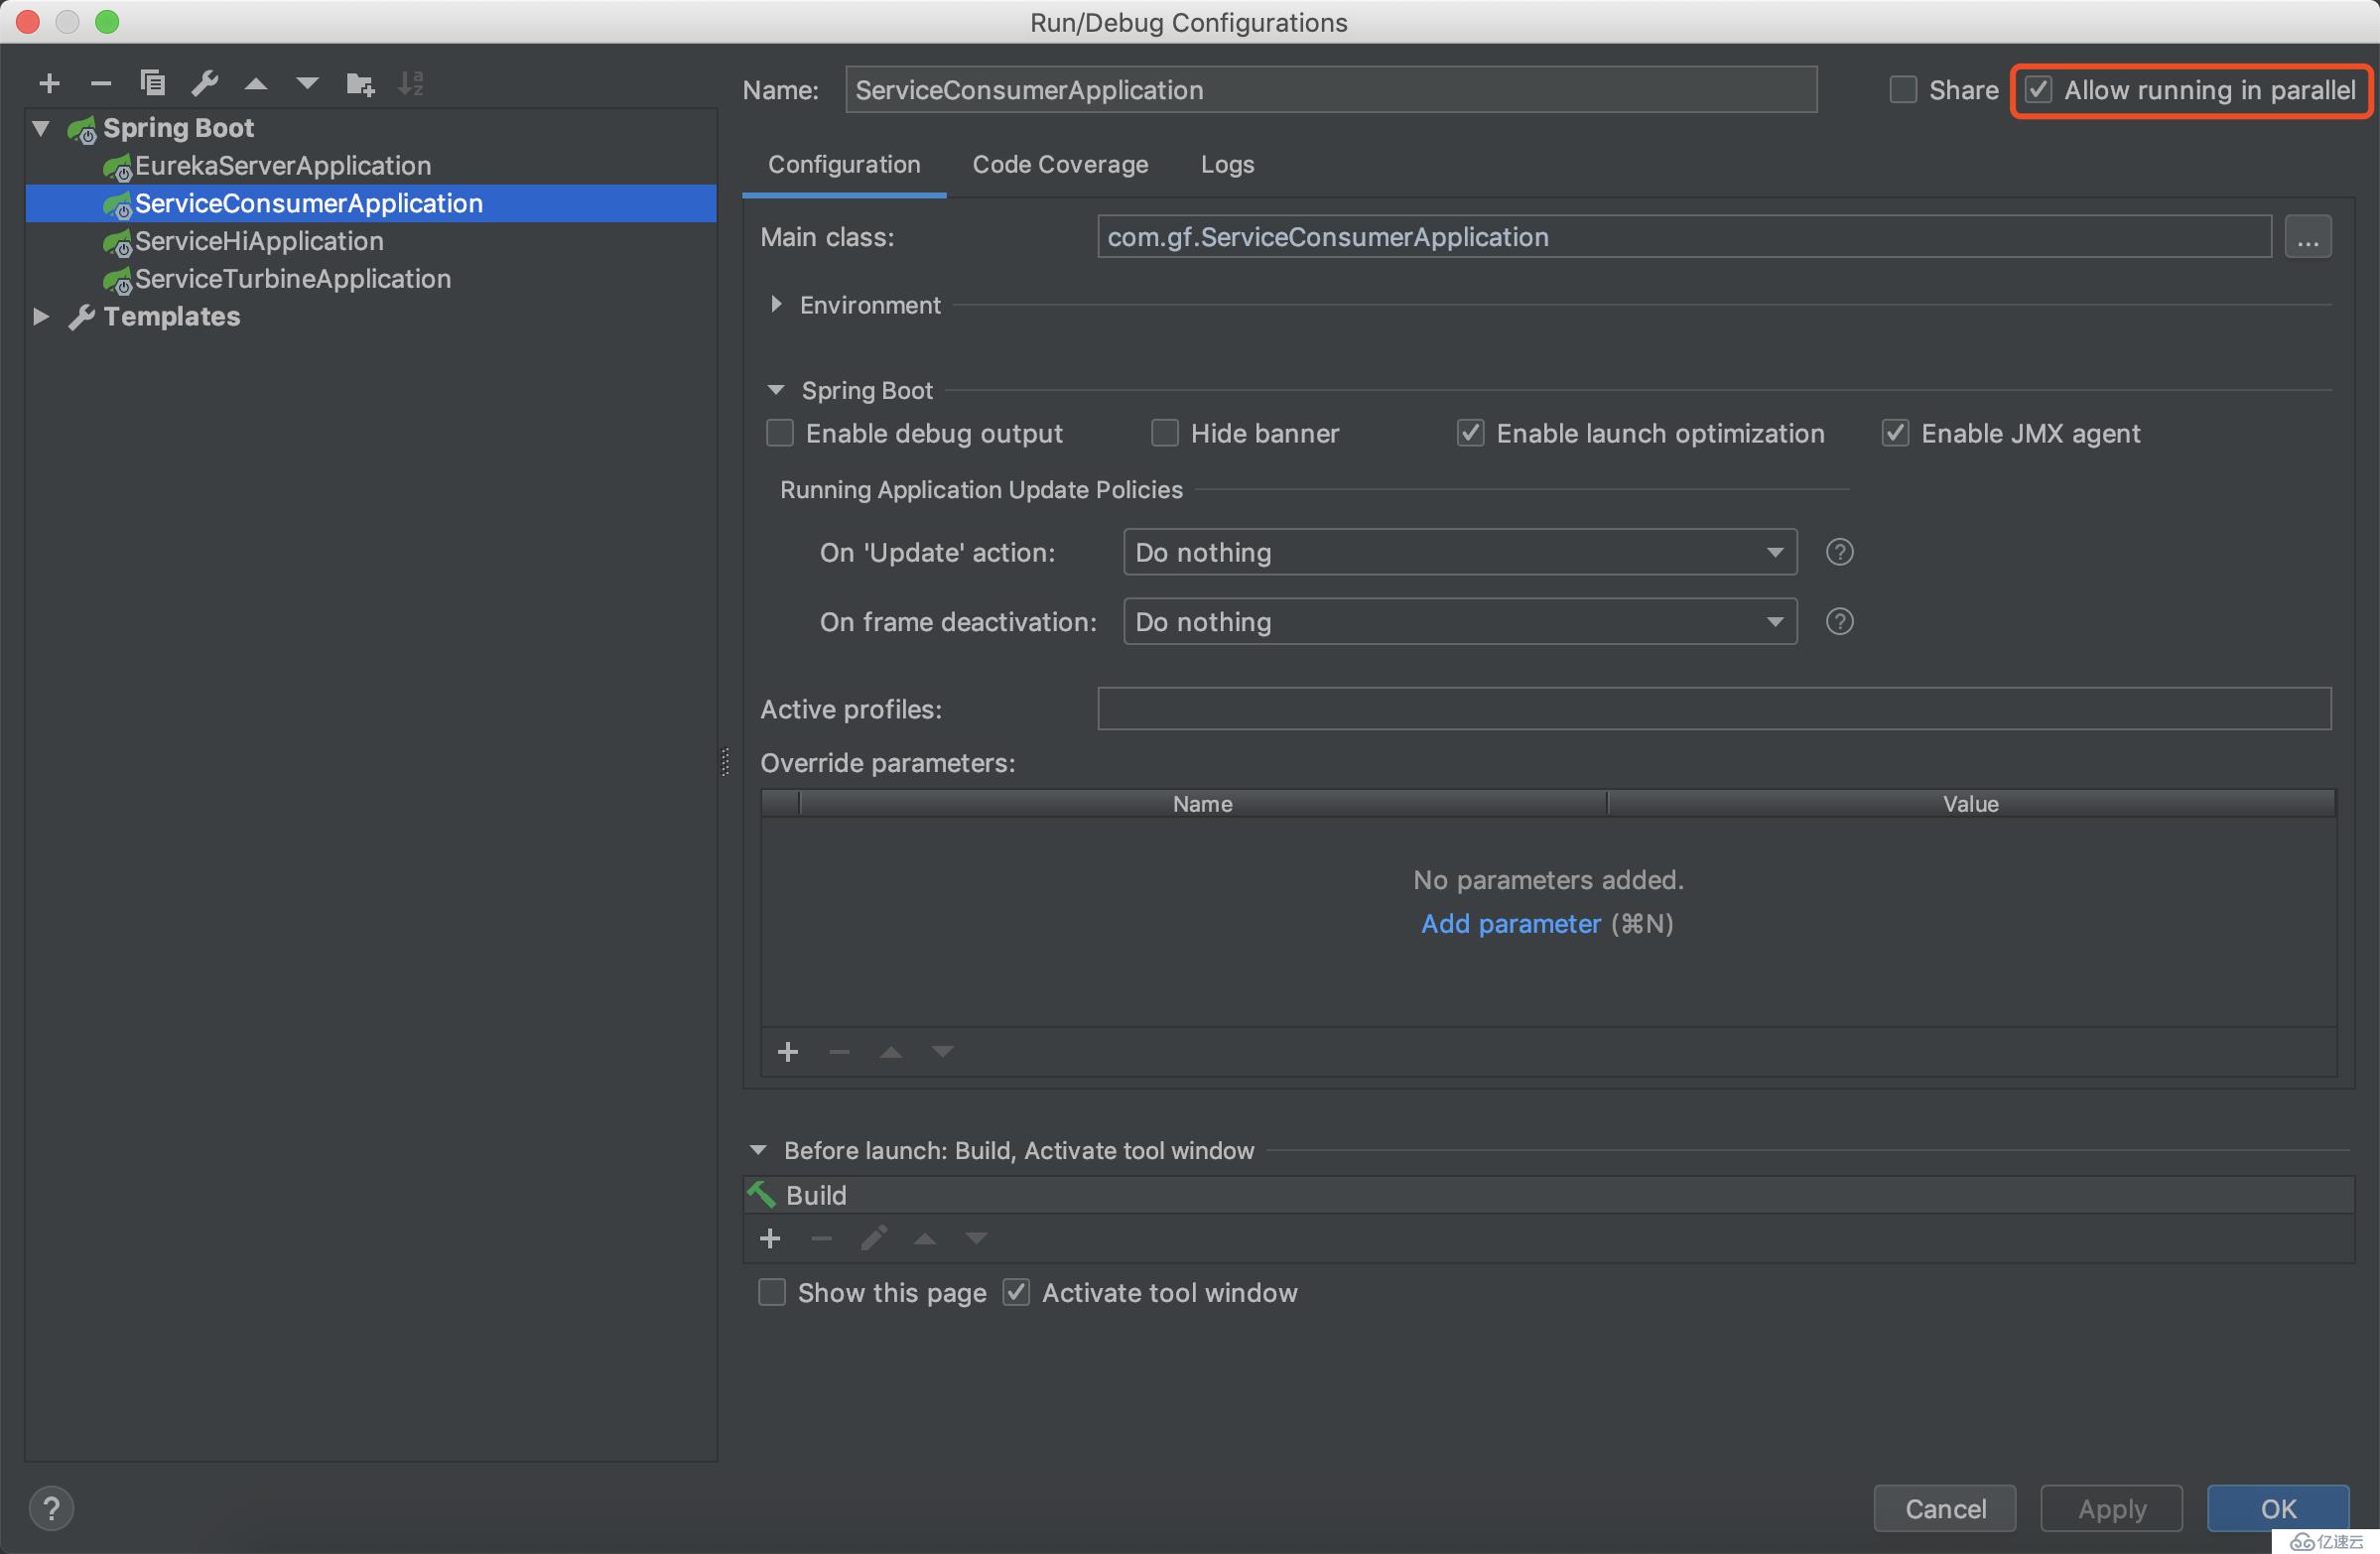
勾选 “Allow running in parallel”
启动工程,访问 http//localhost:8763/hi , http//localhost:8764/hi , http//localhost:8763/oh , http//localhost:8764/oh,来产生测试数据。
访问 http://localhost:8765/hystrix ,
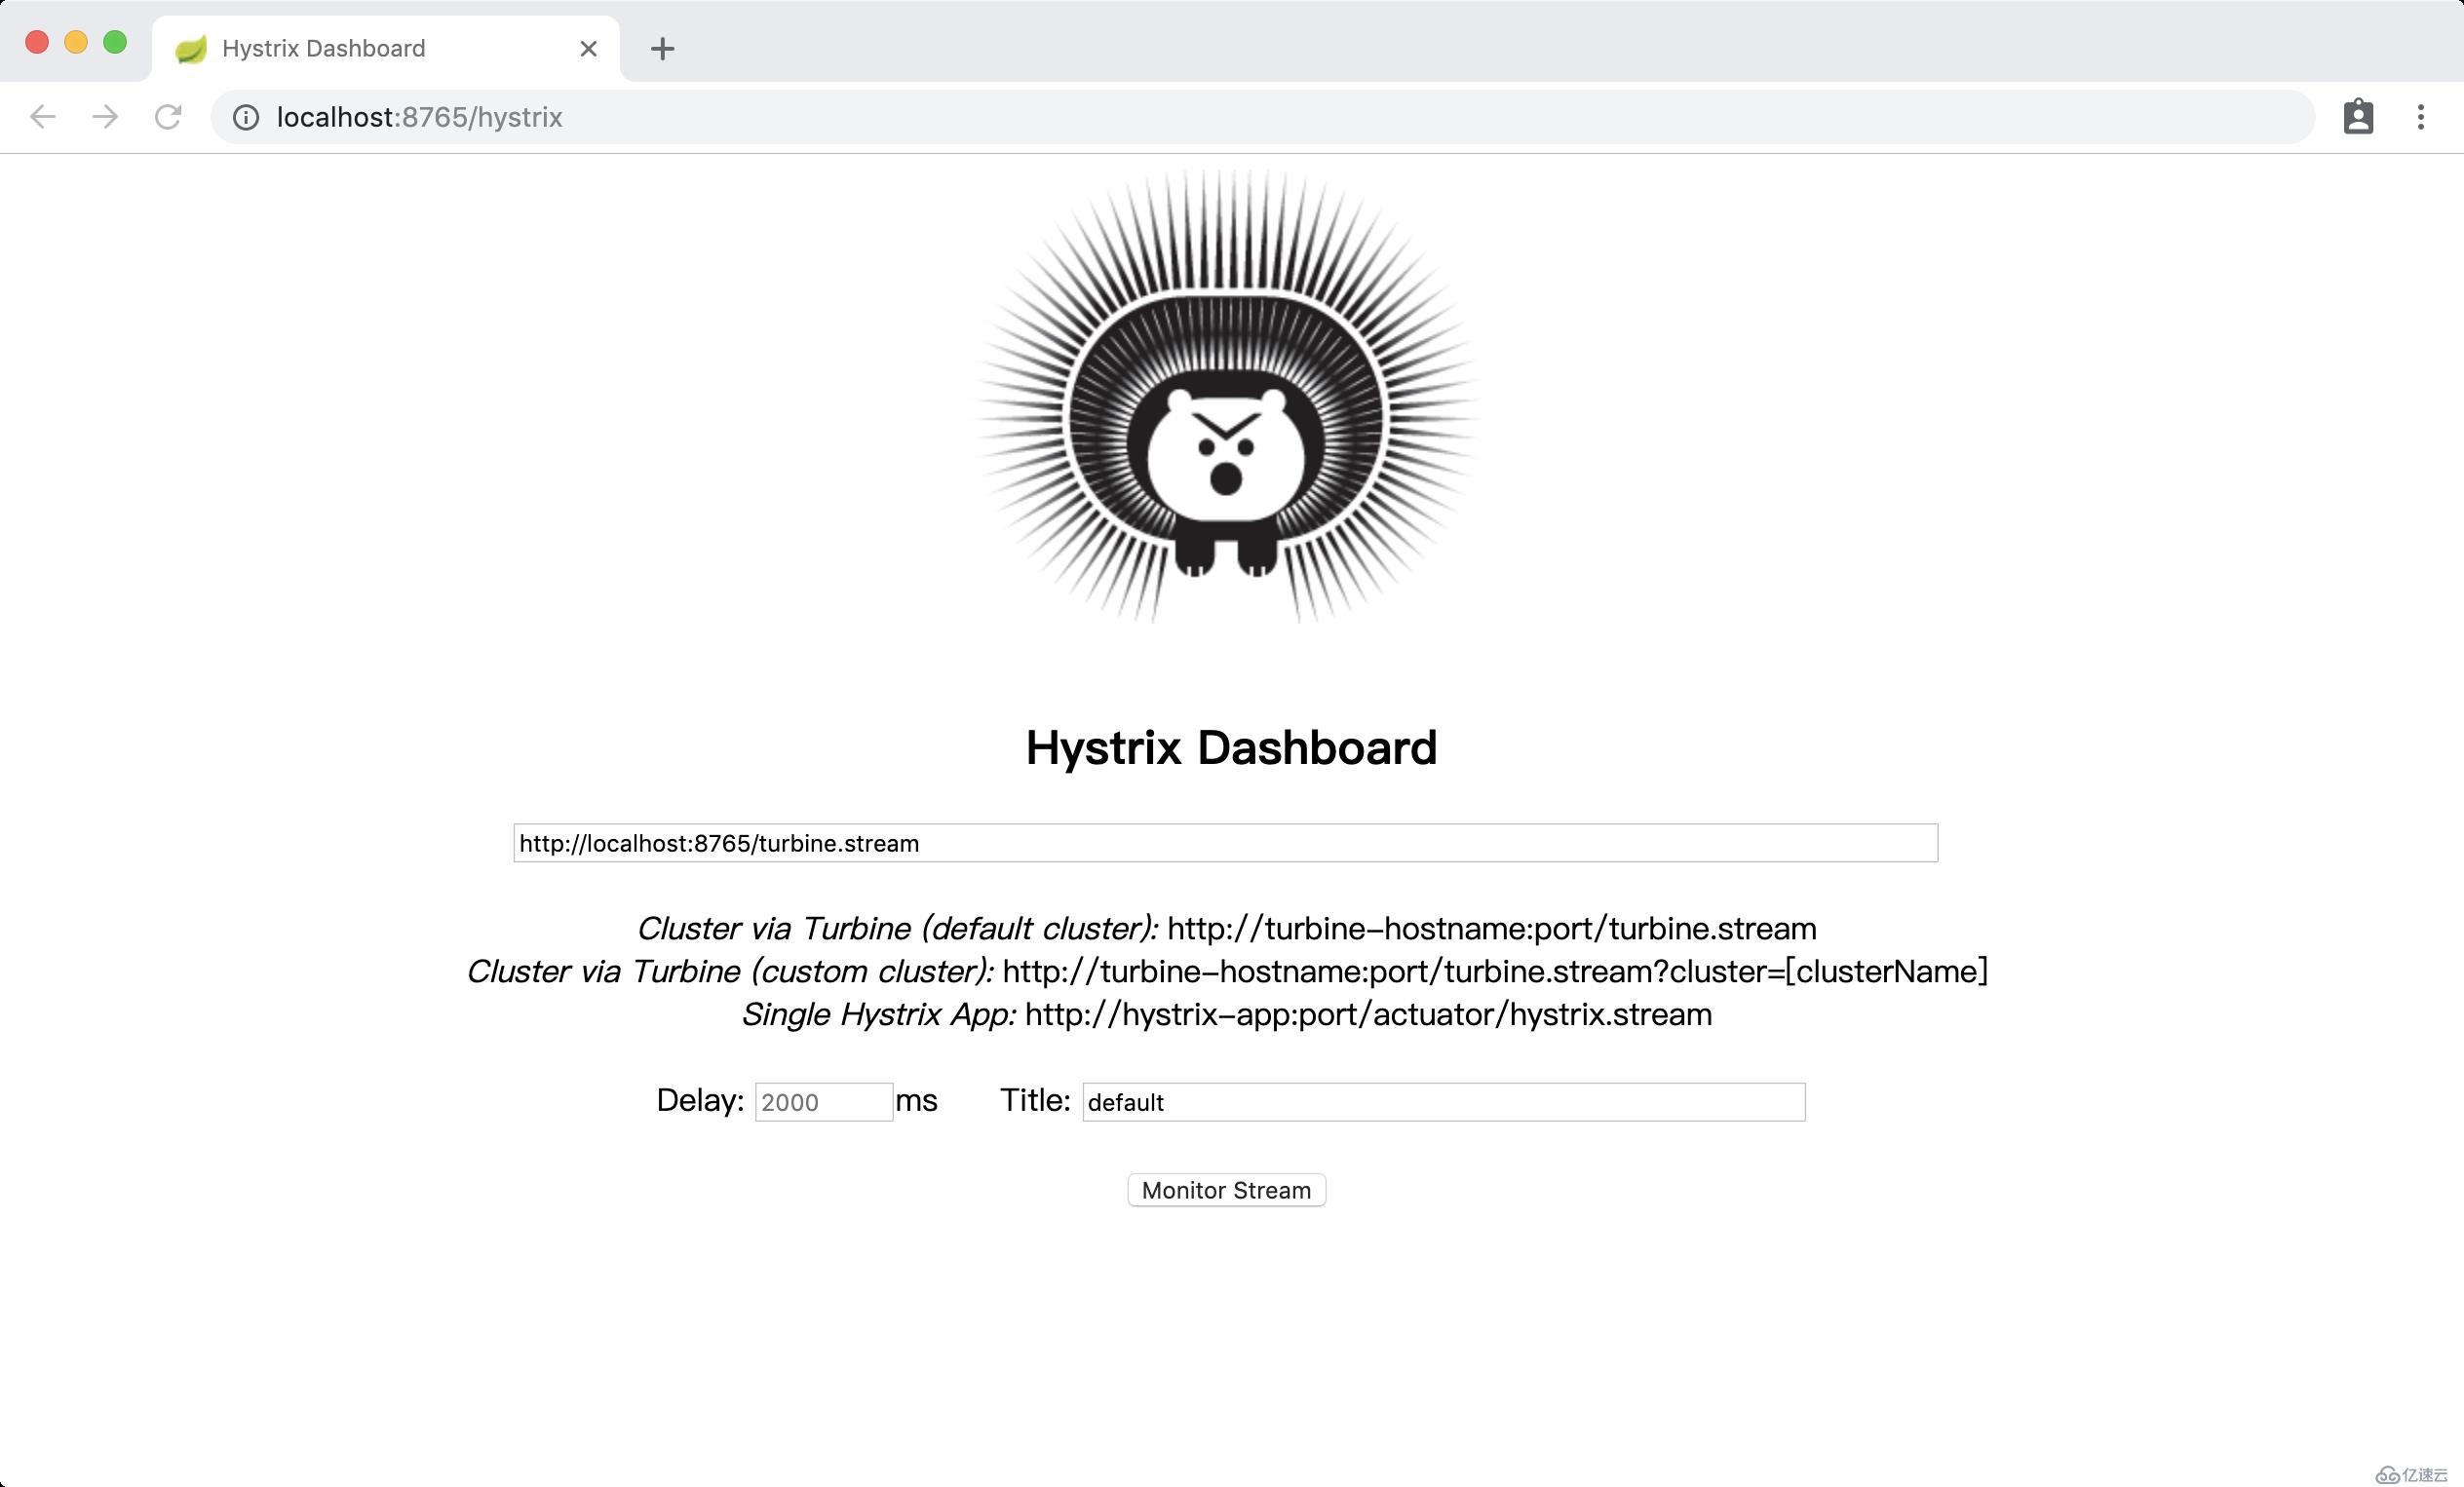
输入监控流地址 http://localhost:8765/turbine.stream ,点击 Monitor Stream 进入监控页面
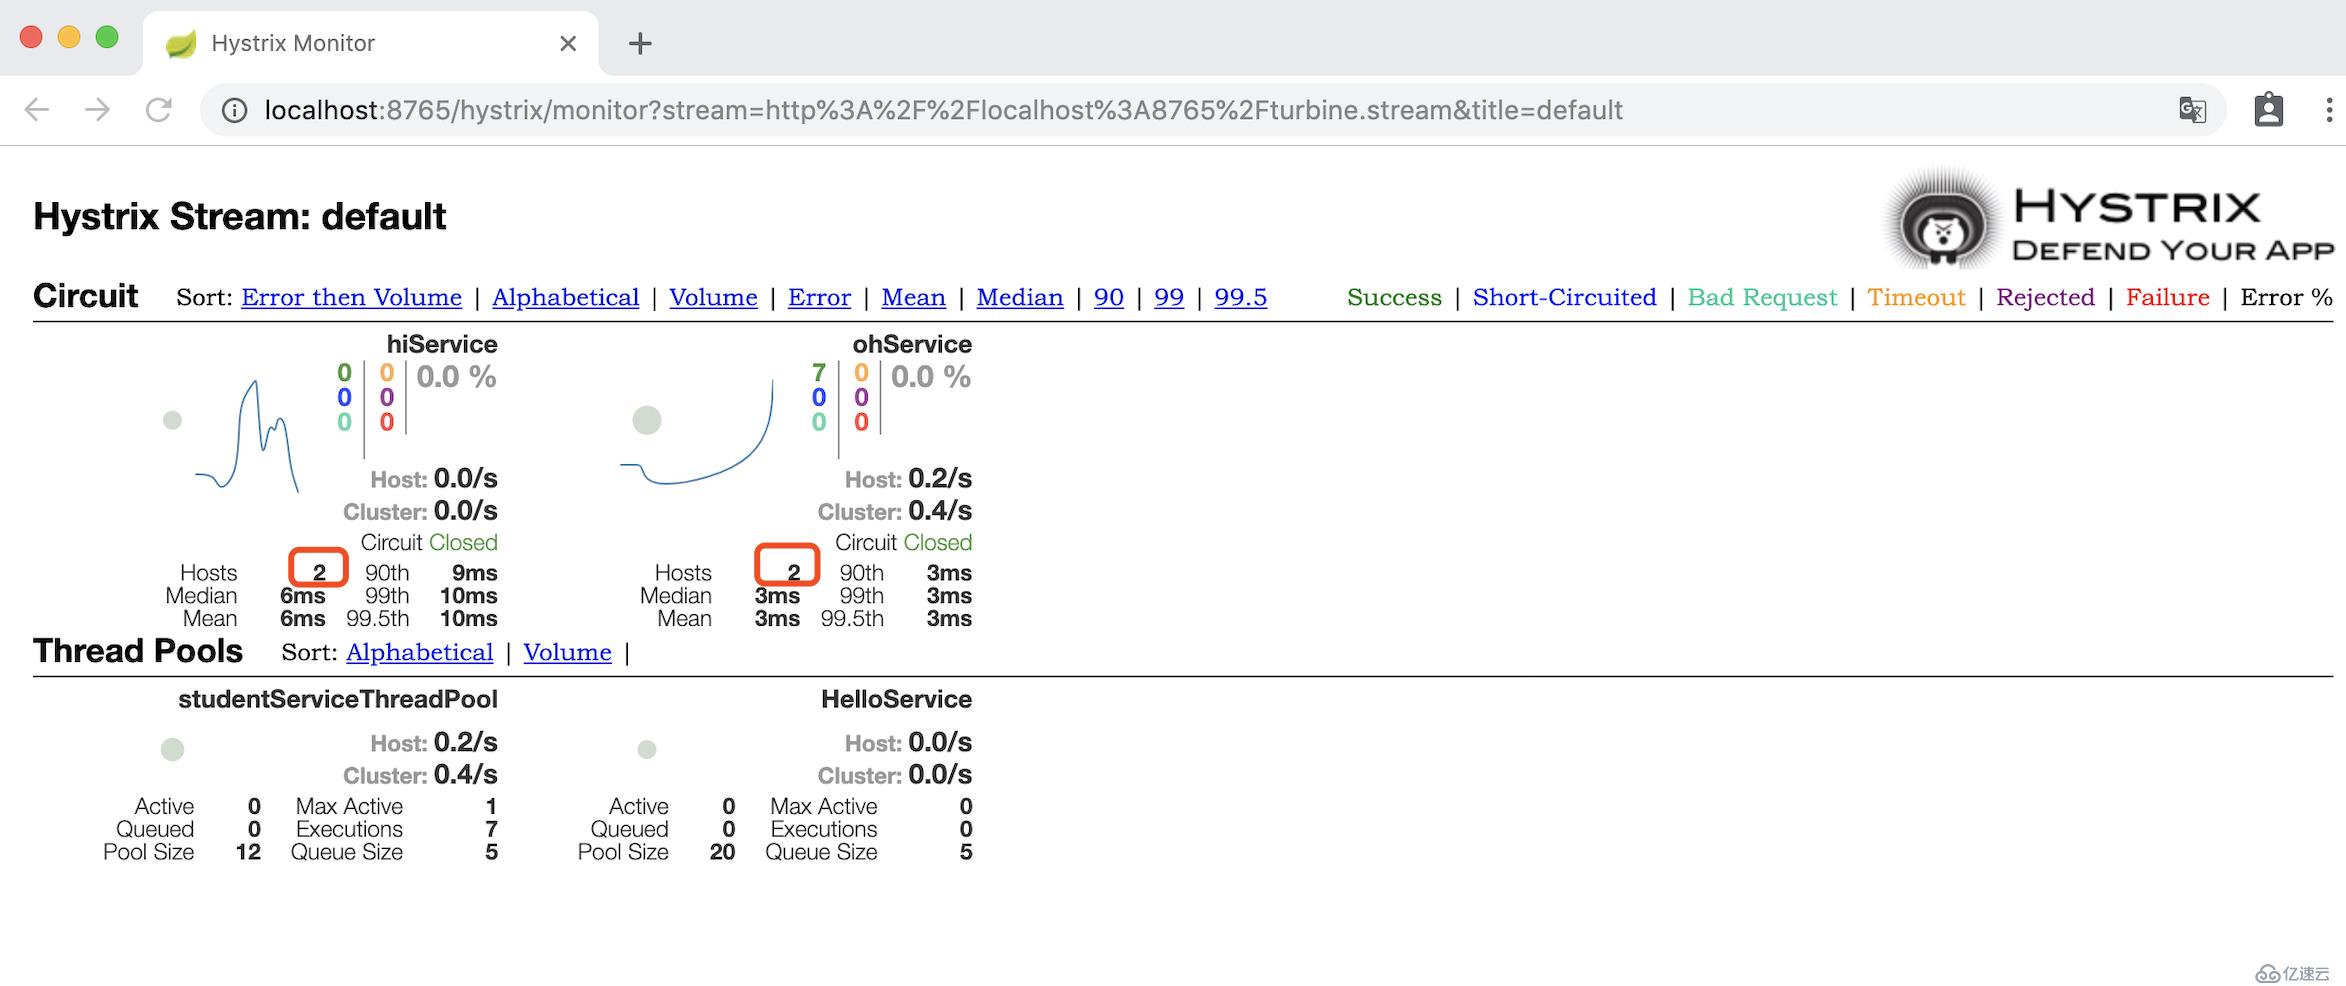
可以看到聚合了两个实例的 Hystrix dashbord 数据。
https://github.com/gf-huanchupk/SpringCloudLearning/tree/master/chapter18
欢迎关注我的公众号《程序员果果》,关注有惊喜~~
免责声明:本站发布的内容(图片、视频和文字)以原创、转载和分享为主,文章观点不代表本网站立场,如果涉及侵权请联系站长邮箱:is@yisu.com进行举报,并提供相关证据,一经查实,将立刻删除涉嫌侵权内容。