您好,登录后才能下订单哦!
密码登录
登录注册
点击 登录注册 即表示同意《亿速云用户服务条款》
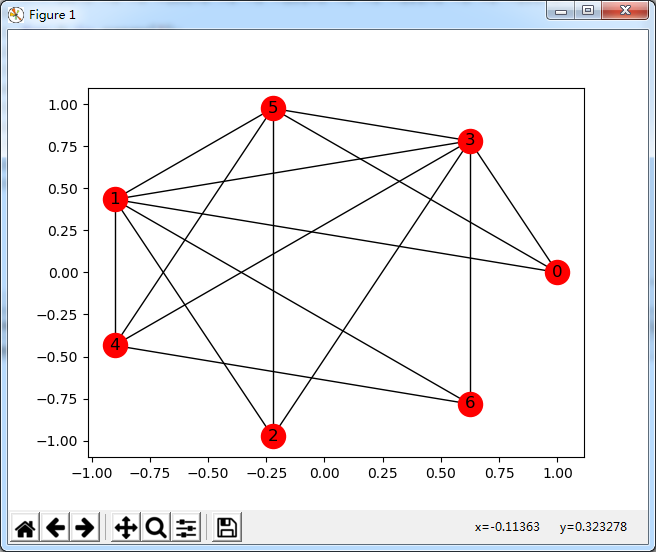
本文实例讲述了Python根据已知邻接矩阵绘制无向图操作。分享给大家供大家参考,具体如下:
有六个点:[0,1,2,3,4,5,6],六个点之间的邻接矩阵如表格所示,根据邻接矩阵绘制出相对应的图
|
|
0 |
1 |
2 |
3 |
4 |
5 |
6 |
|
0 |
0 |
1 |
0 |
1 |
0 |
1 |
0 |
|
1 |
1 |
0 |
1 |
1 |
1 |
1 |
1 |
|
2 |
0 |
1 |
0 |
1 |
0 |
1 |
0 |
|
3 |
1 |
1 |
1 |
0 |
1 |
1 |
1 |
|
4 |
0 |
1 |
0 |
1 |
1 |
1 |
1 |
|
5 |
1 |
1 |
1 |
1 |
1 |
0 |
0 |
|
6 |
0 |
1 |
0 |
1 |
1 |
0 |
0 |
将点之间的联系构造成如下矩阵
N = [[0, 3, 5, 1],
[1, 5, 4, 3],
[2, 1, 3, 5],
[3, 5, 1, 4],
[4, 5, 1, 3],
[5, 3, 4, 1],
[6, 3, 1, 4]]
代码如下
# -*- coding:utf-8 -*-
#! python3
import networkx as nx
import matplotlib.pyplot as plt
G=nx.Graph()
point=[0,1,2,3,4,5,6]
G.add_nodes_from(point)
edglist=[]
N = [[0, 3, 5, 1],[1, 5, 4, 3],[2, 1, 3, 5],[3, 5, 1, 4],[4, 5, 1, 3],[5, 3, 4, 1],[6, 3, 1, 4]]
for i in range(7):
  for j in range(1,4):
    edglist.append((N[i][0],N[i][j]))
G=nx.Graph(edglist)
position = nx.circular_layout(G)
nx.draw_networkx_nodes(G,position, nodelist=point, node_color="r")
nx.draw_networkx_edges(G,position)
nx.draw_networkx_labels(G,position)
plt.show()
显示结果:
更多关于Python相关内容可查看本站专题:《Python数学运算技巧总结》、《Python正则表达式用法总结》、《Python数据结构与算法教程》、《Python函数使用技巧总结》、《Python字符串操作技巧汇总》及《Python入门与进阶经典教程》
希望本文所述对大家Python程序设计有所帮助。
免责声明:本站发布的内容(图片、视频和文字)以原创、转载和分享为主,文章观点不代表本网站立场,如果涉及侵权请联系站长邮箱:is@yisu.com进行举报,并提供相关证据,一经查实,将立刻删除涉嫌侵权内容。